Exam 1: Getting Started
Exam 1: Getting Started347 Questions
Exam 2: The U.S.and Global Economies211 Questions
Exam 3: The Economic Problem283 Questions
Exam 4: Demand and Supply334 Questions
Exam 5: Elasticities of Demand and Supply342 Questions
Exam 6: Efficiency and Fairness of Markets362 Questions
Exam 7: Government Actions in Markets248 Questions
Exam 8: Taxes270 Questions
Exam 9: Global Markets in Action281 Questions
Exam 10: Externalities301 Questions
Exam 11: Public Goods and Common Resources180 Questions
Exam 12: Markets with Private Information103 Questions
Exam 13: Consumer Choice and Demand295 Questions
Exam 14: Production and Cost274 Questions
Exam 15: Perfect Competition285 Questions
Exam 16: Monopoly384 Questions
Exam 17: Monopolistic Competition221 Questions
Exam 18: Oligopoly228 Questions
Exam 19: Markets for Factors of Production188 Questions
Exam 20: Economic Inequality164 Questions
Select questions type
Demonstrating how an economic variable changes from one year to the next is best illustrated by a
(Multiple Choice)
5.0/5  (30)
(30)
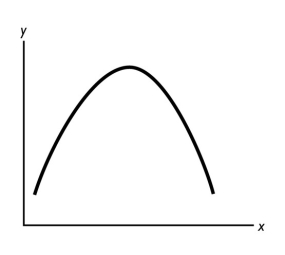 -In the figure above,the relationship between the x variable and the y variable
(Multiple Choice)
4.9/5 (32)
Shaniq can spend the next hour studying for a finance test,hiking along the Oregon coast,watching reruns of Lost on television,or napping.If she decides to study,what is the opportunity cost of her choice: hiking,watching television,or napping?
(Essay)
4.8/5 (41)
Which of the following is true?
i.A rational choice is made on the margin.
ii.Microeconomics is the study of the national economy while macroeconomics is the study of the global economy.
iii.Economists try to understand how the economic world works by testing normative statements.
(Multiple Choice)
5.0/5 (32)
In making your decision whether to take a trip during spring break,you compare all the other activities you could undertake.As a result,you
(Multiple Choice)
4.9/5 (36)
If a small change in the x variable results in a large change in the y variable,the curve will be
(Multiple Choice)
4.8/5 (28)
Suppose that,instead of taking this test,you could either have worked and earned income or partied and had a pleasurable time.Your opportunity cost of taking the test is the
(Multiple Choice)
4.8/5 (38)
"As the price of gasoline increases,fewer people buy cars that are gas guzzlers." A graph showing this relationship would
(Multiple Choice)
4.8/5 (38)
Will,Bill,and Phil decide to study an extra hour for an exam.Instead of studying,they could have gone out to eat,played football,or watched TV.Which of the following statements is correct?
(Multiple Choice)
4.9/5 (41)
A graph shows the average SAT scores for males and females in 2012.The kind of graph used to show these data would be a
(Multiple Choice)
4.8/5 (29)
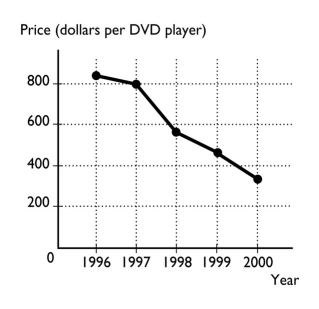 -The figure above shows the price of a DVD player from 1996 to 2000.
a.What type of graph is illustrated above?
b.What is the trend in the price of a DVD player?
-The figure above shows the price of a DVD player from 1996 to 2000.
a.What type of graph is illustrated above?
b.What is the trend in the price of a DVD player?
(Essay)
4.8/5 (32)
When economists use the term "correlation," they are referring to
(Multiple Choice)
4.9/5 (41)
Which of the following scenarios describes an action that is not rational from an economic point of view?
(Multiple Choice)
4.8/5 (37)
Which economic question depends on the incomes that people earn and the prices they pay for goods and services?
(Multiple Choice)
5.0/5 (38)
What is the reason that all economic issues and problems occur?
(Multiple Choice)
4.8/5 (33)
Filters
- Essay(0)
- Multiple Choice(0)
- Short Answer(0)
- True False(0)
- Matching(0)