Exam 1: Getting Started
Exam 1: Getting Started347 Questions
Exam 2: The U.S.and Global Economies211 Questions
Exam 3: The Economic Problem283 Questions
Exam 4: Demand and Supply334 Questions
Exam 5: Elasticities of Demand and Supply342 Questions
Exam 6: Efficiency and Fairness of Markets362 Questions
Exam 7: Government Actions in Markets248 Questions
Exam 8: Taxes270 Questions
Exam 9: Global Markets in Action281 Questions
Exam 10: Externalities301 Questions
Exam 11: Public Goods and Common Resources180 Questions
Exam 12: Markets with Private Information103 Questions
Exam 13: Consumer Choice and Demand295 Questions
Exam 14: Production and Cost274 Questions
Exam 15: Perfect Competition285 Questions
Exam 16: Monopoly384 Questions
Exam 17: Monopolistic Competition221 Questions
Exam 18: Oligopoly228 Questions
Exam 19: Markets for Factors of Production188 Questions
Exam 20: Economic Inequality164 Questions
Select questions type
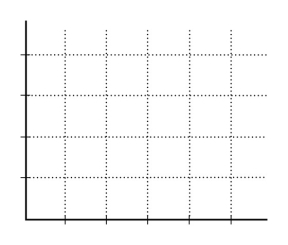
Price (dollars per blouse) 20 40 60 80 Katie's purchases (blouses per year) 10 8 6 4 Kim's purchases (blouses per year) 6 5 4 3
-The table above shows how many blouses Katie and Kim will purchase at different prices for a blouse.In the figure,label the axes and put the price on the y-axis and the quantity of blouses on the x-axis.Plot the data for Katie in the figure.Then,plot the data for Kim in the figure.
(Essay)
4.9/5  (29)
(29)
If there is a positive relationship between two variables,
(Multiple Choice)
4.8/5 (35)
Huey has eaten two hamburgers and is considering a third.The marginal benefit in his decision is the pleasure from consuming
(Multiple Choice)
4.8/5 (40)
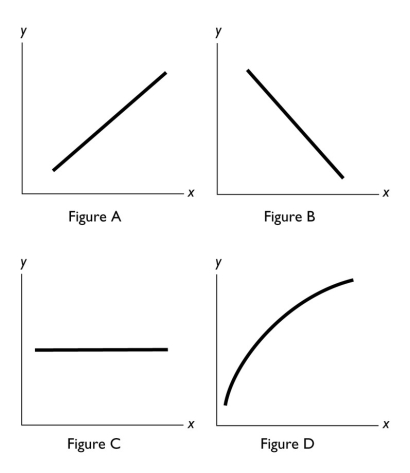 -In the above figure,which of the figures show(s)a relationships between x and y with a positive slope?
(Multiple Choice)
4.7/5 (31)
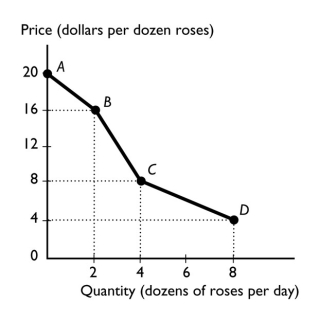 -The figure above shows the relationship between the price of a dozen roses and the quantity of roses a florist can sell.The slope between points B and C equals
(Multiple Choice)
4.8/5 (34)
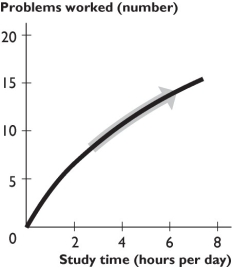 -The figure above shows the relationship between study time and the number of problems worked.The curve becomes less steep because as you study more,
(Multiple Choice)
4.8/5 (36)
Suppose you eat two hamburgers for lunch.The marginal benefit of the first burger is ________ of the second burger.
(Multiple Choice)
4.8/5 (31)
"Lower ticket prices would lead to more people attending ballgames." This statement is a
(Multiple Choice)
4.7/5 (23)
A graph shows the wage rate of factory workers.The slope of the line is positive for periods when the wage rate is
(Multiple Choice)
4.9/5 (33)
Discuss what is necessary to make rational decisions.Be sure to mention opportunity cost,marginal cost,and marginal benefit.
(Essay)
5.0/5 (38)
Which of the following is an example of a normative economic statement?
(Multiple Choice)
4.9/5 (32)
x variable (on the horizontal axis) y variable (on the vertical axis) 100 50 200 125 300 200
-The table above shows data on two variables.If these data were graphed,the slope of the line would be
(Multiple Choice)
4.9/5 (34)
The value of the best thing that a person must give up when making a decision is known as the ________ cost.
(Multiple Choice)
4.8/5 (31)
Jamie has enough money to buy either a Mountain Dew,or a Pepsi,or a bag of chips.He chooses to buy the Mountain Dew.The opportunity cost of the Mountain Dew is
(Multiple Choice)
4.8/5 (37)
A graph of the value of one variable against the value of another variable is known as a
(Multiple Choice)
4.8/5 (41)
Filters
- Essay(0)
- Multiple Choice(0)
- Short Answer(0)
- True False(0)
- Matching(0)