Exam 1: Getting Started
Exam 1: Getting Started347 Questions
Exam 2: The U.S.and Global Economies211 Questions
Exam 3: The Economic Problem283 Questions
Exam 4: Demand and Supply334 Questions
Exam 5: Elasticities of Demand and Supply342 Questions
Exam 6: Efficiency and Fairness of Markets362 Questions
Exam 7: Government Actions in Markets248 Questions
Exam 8: Taxes270 Questions
Exam 9: Global Markets in Action281 Questions
Exam 10: Externalities301 Questions
Exam 11: Public Goods and Common Resources180 Questions
Exam 12: Markets with Private Information103 Questions
Exam 13: Consumer Choice and Demand295 Questions
Exam 14: Production and Cost274 Questions
Exam 15: Perfect Competition285 Questions
Exam 16: Monopoly384 Questions
Exam 17: Monopolistic Competition221 Questions
Exam 18: Oligopoly228 Questions
Exam 19: Markets for Factors of Production188 Questions
Exam 20: Economic Inequality164 Questions
Select questions type
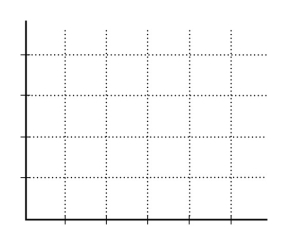
Hours studied (per week) SAT Scores 2 900 4 1000 6 1050 8 1075 10 1090
-Jamie is preparing to take his SAT tests.The table above shows how Jamie's score depends on the number of hours a week Jamie studies
a.Plot the relationship in the figure,putting the hours studied on the horizontal axis.
 b.Is the relationship you plotted positive or negative?
c.What happens to the slope of the relationship as hours studied increase?
d.Suppose Jamie can enroll in an SAT prep course and,by so doing,for every possible number of hours he studies,his score will be 100 points higher.Plot the new relationship between the number of hours studied and Jamie's SAT score in the figure.
e.How many variables are involved in the figure you just completed?
b.Is the relationship you plotted positive or negative?
c.What happens to the slope of the relationship as hours studied increase?
d.Suppose Jamie can enroll in an SAT prep course and,by so doing,for every possible number of hours he studies,his score will be 100 points higher.Plot the new relationship between the number of hours studied and Jamie's SAT score in the figure.
e.How many variables are involved in the figure you just completed?
(Essay)
4.9/5  (30)
(30)
A positive statement
i.makes a statement about how the world operates.
ii.is a true statement.
iii.can be tested against the facts.
(Multiple Choice)
5.0/5 (28)
A normative statement
i.can be tested as to whether it is true or false.
ii.is considered negative.
iii.depends on a person's values.
(Multiple Choice)
4.7/5 (35)
Which of the following is true regarding this statement? "The president's decision to spend more money on national defense is smart."
(Multiple Choice)
4.8/5 (41)
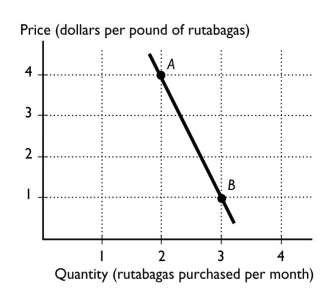
 -The figure above shows the relationship between the price of a dozen roses and the quantity of roses a florist can sell.The slope between points C and D equals
(Multiple Choice)
4.8/5 (36)
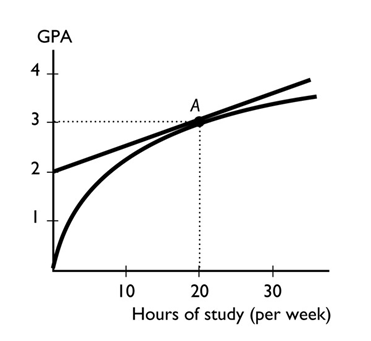
 -In the figure above,between points A and B,what is the slope of the line?
(Multiple Choice)
4.8/5 (36)
Which of the following is true regarding a normative statement?
i.It uses the ceteris paribus assumption.
ii.It is a value judgment.
iii.It accounts for opportunity costs.
(Multiple Choice)
4.9/5 (38)
Kevin is re-finishing an antique grandfather clock that he purchased at a flea market for $300.He expects to be able to sell the clock for $450.At the last minute,Kevin discovers that he needs to repair the gears at a cost of $175 to make the clock worth $450 to potential buyers.It turns out that he could also sell the clock now,without completing the additional repairs,for $250.What should Kevin do?
(Multiple Choice)
4.8/5 (39)
Why is the benefit of something measured by what you are willing to give up?
(Essay)
4.8/5 (32)
Filters
- Essay(0)
- Multiple Choice(0)
- Short Answer(0)
- True False(0)
- Matching(0)