Exam 1: Getting Started
Exam 1: Getting Started347 Questions
Exam 2: The U.S.and Global Economies211 Questions
Exam 3: The Economic Problem283 Questions
Exam 4: Demand and Supply334 Questions
Exam 5: Elasticities of Demand and Supply342 Questions
Exam 6: Efficiency and Fairness of Markets362 Questions
Exam 7: Government Actions in Markets248 Questions
Exam 8: Taxes270 Questions
Exam 9: Global Markets in Action281 Questions
Exam 10: Externalities301 Questions
Exam 11: Public Goods and Common Resources180 Questions
Exam 12: Markets with Private Information103 Questions
Exam 13: Consumer Choice and Demand295 Questions
Exam 14: Production and Cost274 Questions
Exam 15: Perfect Competition285 Questions
Exam 16: Monopoly384 Questions
Exam 17: Monopolistic Competition221 Questions
Exam 18: Oligopoly228 Questions
Exam 19: Markets for Factors of Production188 Questions
Exam 20: Economic Inequality164 Questions
Select questions type
To graph a relationship involving more than two variables,we use which assumption?
(Multiple Choice)
4.9/5  (39)
(39)
Instead of studying for an additional two hours for the economics final,Leann decides to watch a movie.Leann is making
(Multiple Choice)
4.7/5 (32)
A graph that shows the value of an economic variable for different groups in a population at a given time is called a
(Multiple Choice)
4.7/5 (31)
To show the values of an economic variable for different groups in a population at a point in time,it is best to use a
(Multiple Choice)
4.8/5 (39)
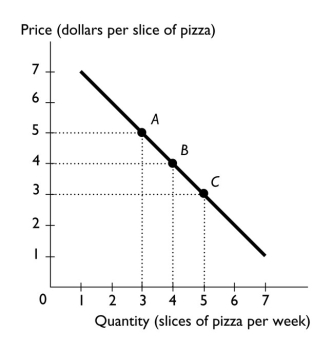 -The above figure shows the relationship between the price of a slice of pizza and how many slices of pizza Ricardo buys in a week.Between points A and B,the slope of the line equals
(Multiple Choice)
4.9/5 (35)
Explain whether the statement "The government should increase tariffs on Japanese cars to protect the American car industry from competition," is a normative or positive statement.
(Essay)
4.8/5 (31)
The question "Should we produce LCD televisions or computer monitors?" is an example of a ________ question.
(Multiple Choice)
4.9/5 (44)
When a landscaping company decides to use drafting software and computers instead of hiring designers to draw design plans by hand,it is answering the ________ question.
(Multiple Choice)
4.8/5 (34)
Suppose that your public library charges a fixed monthly membership fee of $12.Members are allowed to check out as many books as they want under this plan.The average member checks out 4 books per month.Suppose that your public library changes its policy.Now each book costs $3 to check out but there is no longer a monthly membership fee.What effect do you think the new policy will have on the total number of books checked out from your library each month? The new policy is likely to ______the number of booked checked out because ________.
(Multiple Choice)
4.9/5 (39)
List and explain the three fundamental economic questions that must be answered by all economic systems.
(Essay)
4.7/5 (35)
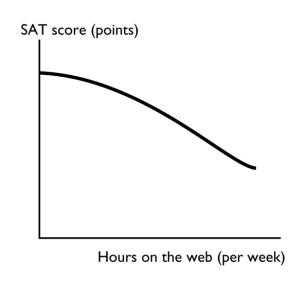 -The figure above shows how the relationship between the number of hours per week a high school student spends on the web and the student's SAT score.Is the relationship between hours on the web and the SAT score positive,negative,neither? Explain your answer.
(Essay)
4.9/5 (41)
Filters
- Essay(0)
- Multiple Choice(0)
- Short Answer(0)
- True False(0)
- Matching(0)