Exam 1: Getting Started
Exam 1: Getting Started347 Questions
Exam 2: The U.S.and Global Economies211 Questions
Exam 3: The Economic Problem283 Questions
Exam 4: Demand and Supply334 Questions
Exam 5: Elasticities of Demand and Supply342 Questions
Exam 6: Efficiency and Fairness of Markets362 Questions
Exam 7: Government Actions in Markets248 Questions
Exam 8: Taxes270 Questions
Exam 9: Global Markets in Action281 Questions
Exam 10: Externalities301 Questions
Exam 11: Public Goods and Common Resources180 Questions
Exam 12: Markets with Private Information103 Questions
Exam 13: Consumer Choice and Demand295 Questions
Exam 14: Production and Cost274 Questions
Exam 15: Perfect Competition285 Questions
Exam 16: Monopoly384 Questions
Exam 17: Monopolistic Competition221 Questions
Exam 18: Oligopoly228 Questions
Exam 19: Markets for Factors of Production188 Questions
Exam 20: Economic Inequality164 Questions
Select questions type
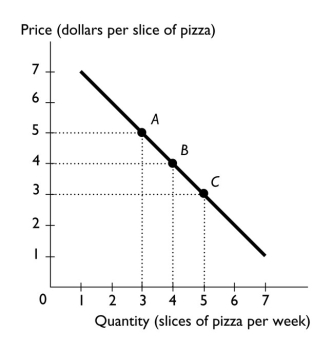 -The above figure shows the relationship between the price of a slice of pizza and how many slices of pizza Ricardo buys in a week.Between points A and B,the slope of the line is ________ the slope of the line between points B and C.
(Multiple Choice)
4.7/5  (40)
(40)
Which of the following is a microeconomic topic?
i.K-Mart's decision to close stores that are not making a profit
ii.Home Depot's choice to hire more full-time employees because its sales increased
iii.Delta Airlines changes its fares.
(Multiple Choice)
4.8/5 (29)
A professor changes the penalty for cheating on exams from getting a 0 on the exam to getting an F in the course.The professor has
(Multiple Choice)
4.9/5 (33)
If whenever one variable increases,another variable also increases,then these two variables are ________ related.
(Multiple Choice)
4.8/5 (37)
When two variables in a graph are related to a third,changing the third causes
(Multiple Choice)
4.8/5 (27)
When Gabriel made a rational choice to spend his entire allowance on candy bars,he did so by comparing the
(Multiple Choice)
4.8/5 (35)
You have data for sales of pizza for each of the 50 states in 2011.The type of graph to best display these data would be a
(Multiple Choice)
4.9/5 (32)
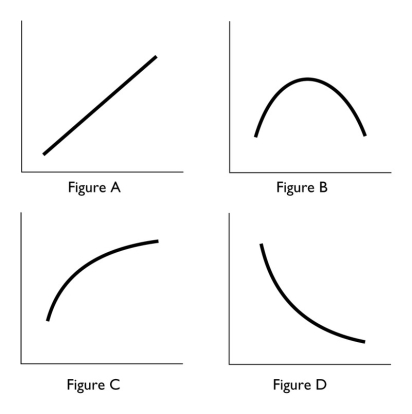 -In the above,which figure(s)show(s)relationship between the variables that is always positive?
(Multiple Choice)
4.8/5 (34)
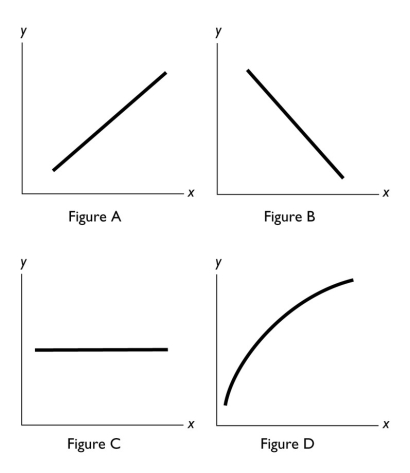 -In the above figure,which of the figures shows a relationship between x and y with a negative slope?
(Multiple Choice)
4.8/5 (35)
The opportunity cost of a decision is measured in terms of
(Multiple Choice)
4.8/5 (39)
Most economic graphs have two lines perpendicular to each other.The vertical line is called the
(Multiple Choice)
4.8/5 (35)
Filters
- Essay(0)
- Multiple Choice(0)
- Short Answer(0)
- True False(0)
- Matching(0)