Exam 1: Getting Started
Exam 1: Getting Started347 Questions
Exam 2: The U.S.and Global Economies211 Questions
Exam 3: The Economic Problem283 Questions
Exam 4: Demand and Supply334 Questions
Exam 5: Elasticities of Demand and Supply342 Questions
Exam 6: Efficiency and Fairness of Markets362 Questions
Exam 7: Government Actions in Markets248 Questions
Exam 8: Taxes270 Questions
Exam 9: Global Markets in Action281 Questions
Exam 10: Externalities301 Questions
Exam 11: Public Goods and Common Resources180 Questions
Exam 12: Markets with Private Information103 Questions
Exam 13: Consumer Choice and Demand295 Questions
Exam 14: Production and Cost274 Questions
Exam 15: Perfect Competition285 Questions
Exam 16: Monopoly384 Questions
Exam 17: Monopolistic Competition221 Questions
Exam 18: Oligopoly228 Questions
Exam 19: Markets for Factors of Production188 Questions
Exam 20: Economic Inequality164 Questions
Select questions type
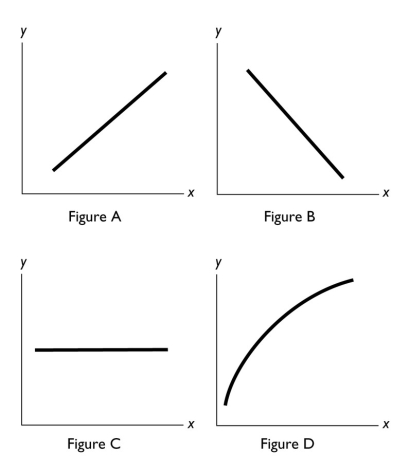 -In the above figure,no relationship between x and y is shown in Figure
(Multiple Choice)
4.8/5  (37)
(37)
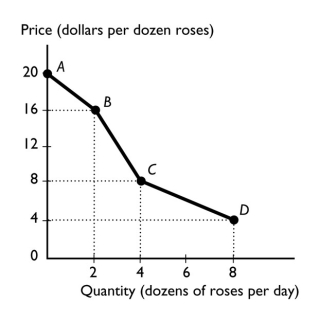 -The figure above shows the relationship between the price of a dozen roses and the quantity of roses a florist can sell.The relationship between the price and the quantity the florist can sell is
(Multiple Choice)
4.8/5 (35)
In New State,the bottling law requires that people get a refund of five cents when they return an empty bottle or can.Why does the state pay people to return bottles? In your answer,be sure to mention the role played by rational choice.
(Essay)
4.8/5 (44)
The marginal benefit of an activity is
i.the benefit from a one-unit increase in the activity.
ii.the benefit of a small,unimportant activity.
iii.measured by what the person is willing to give up to get one additional unit of the activity.
(Multiple Choice)
4.8/5 (31)
Katie's Income (dollars per year) Katie's purchases (books per year) 50,000 14 70,000 16 90,000 18 110,000 20
-The table above shows how the number of books Katie buys each year depends on her income
a.What kind of relationship exists between Katie's income and the number of books she purchases?
 b.Plot the relationship between Katie's income and the number of books she purchases in the above figure.Measure income along the vertical axis and the number of books along the horizontal axis.Be sure to label the axes.
c.What is the slope of the relationship between $50,000 and $70,000 of income?
d.What is the slope of the relationship between $90,000 and $110,000 of income?
e.Comment on the similarity or dissimilarity of your answers to parts (c)and (d).
b.Plot the relationship between Katie's income and the number of books she purchases in the above figure.Measure income along the vertical axis and the number of books along the horizontal axis.Be sure to label the axes.
c.What is the slope of the relationship between $50,000 and $70,000 of income?
d.What is the slope of the relationship between $90,000 and $110,000 of income?
e.Comment on the similarity or dissimilarity of your answers to parts (c)and (d).
(Essay)
4.8/5 (34)
Which of the following is an example of a normative statement?
(Multiple Choice)
4.8/5 (27)
If a decision is made and it is the best choice for society,the decision is said to be
(Multiple Choice)
5.0/5 (33)
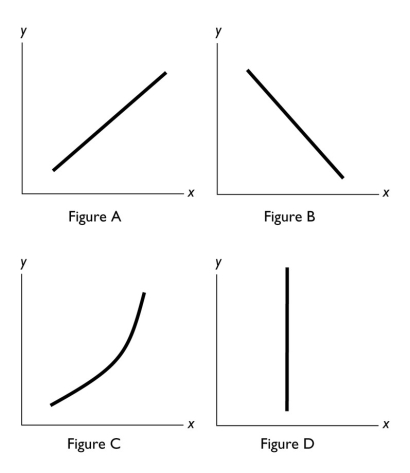 -In the diagram above,which figure(s)show(s)an inverse relationship between the variables?
(Multiple Choice)
4.9/5 (34)
Which of the following is the best example of a "What?" question?
(Multiple Choice)
4.9/5 (37)
A graph of two variables is a vertical line.What is the interpretation of this result?
(Essay)
4.7/5 (33)
To show how a variable ________,we typically use a ________.
(Multiple Choice)
4.7/5 (39)
With y measured on the vertical axis and x measured on the horizontal axis,the slope of a straight line is defined as
(Multiple Choice)
4.7/5 (31)
Suppose the relationship between a person's age and his or her height is plotted with the age measured along the x-axis and the height measured along the y-axis.Then,the curve showing this relationship is
(Multiple Choice)
4.8/5 (31)
Filters
- Essay(0)
- Multiple Choice(0)
- Short Answer(0)
- True False(0)
- Matching(0)