Exam 1: Getting Started
Exam 1: Getting Started347 Questions
Exam 2: The U.S.and Global Economies211 Questions
Exam 3: The Economic Problem283 Questions
Exam 4: Demand and Supply334 Questions
Exam 5: Elasticities of Demand and Supply342 Questions
Exam 6: Efficiency and Fairness of Markets362 Questions
Exam 7: Government Actions in Markets248 Questions
Exam 8: Taxes270 Questions
Exam 9: Global Markets in Action281 Questions
Exam 10: Externalities301 Questions
Exam 11: Public Goods and Common Resources180 Questions
Exam 12: Markets with Private Information103 Questions
Exam 13: Consumer Choice and Demand295 Questions
Exam 14: Production and Cost274 Questions
Exam 15: Perfect Competition285 Questions
Exam 16: Monopoly384 Questions
Exam 17: Monopolistic Competition221 Questions
Exam 18: Oligopoly228 Questions
Exam 19: Markets for Factors of Production188 Questions
Exam 20: Economic Inequality164 Questions
Select questions type
Which of the following statements is the best example of the term ceteris paribus?
(Multiple Choice)
4.9/5  (33)
(33)
What is the difference between a positive and a negative relationship?
(Essay)
4.9/5 (39)
The tendency for the values of two variables to move in a predictable and related way is known as
(Multiple Choice)
4.9/5 (37)
When a home builder decides to computerize all of its production schedule,it directly answers the ________ question.
(Multiple Choice)
4.7/5 (40)
On a graph showing the relationship between x and y,the ceteris paribus condition implies that
(Multiple Choice)
4.8/5 (23)
Which of the following statements is a positive statement?
(Multiple Choice)
4.8/5 (40)
________ shows the values of a variable for different groups in the population at a certain point in time.
(Multiple Choice)
4.7/5 (33)
A curve with a positive but decreasing slope represents a relationship where,every time the variable measured along the horizontal axis increases by one unit,the variable measured along the vertical axis
(Multiple Choice)
4.8/5 (36)
Pumpkins are grown in New Mexico with the aid of fertilizer.Hence,fertilizer is a partial answer to which of the three economic questions?
(Essay)
5.0/5 (39)
A graph that shows how the amount of advertising expenditure differs among various industries can be shown
(Multiple Choice)
4.7/5 (35)
Your friend is preparing for this exam and in your practice session makes the following statement: "Instead of attending microeconomics class for two hours,Kiki could have played tennis or watched a movie.Therefore,the opportunity cost of attending class is the tennis and the movie she had to give up." Is your friend's analysis correct or not? Explain your answer.
(Essay)
4.8/5 (27)
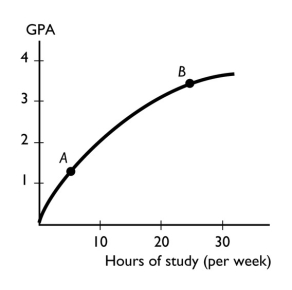 -The figure above shows the relationship between the time a student spends studying and the student's GPA that semester.This figure shows ________ relationship between the time spent studying and the GPA.
(Multiple Choice)
4.7/5 (36)
As the number of days without rain increases,the amount of wheat grown per acre declines.A graph showing this relationship shows
(Multiple Choice)
4.9/5 (30)
The additional benefit of increasing some activity by one-unit is called the
(Multiple Choice)
4.8/5 (36)
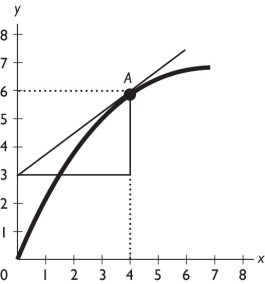 -In the figure above,what is the slope of the curve at point A?
(Multiple Choice)
4.8/5 (35)
When analyzing graphically the relationship between more than two variables,which of the following must be used?
(Multiple Choice)
4.9/5 (31)
Filters
- Essay(0)
- Multiple Choice(0)
- Short Answer(0)
- True False(0)
- Matching(0)