Exam 2: Displaying Data
Exam 1: Statistics and Samples36 Questions
Exam 2: Displaying Data55 Questions
Exam 3: Describing Data49 Questions
Exam 4: Estimating With Uncertainty47 Questions
Exam 5: Probability50 Questions
Exam 6: Hypothesis Testing40 Questions
Exam 7: Analyzing Proportions54 Questions
Exam 8: Fitting Probability Models to Frequency Data53 Questions
Exam 9: Contingency Analysis: Associations Between56 Questions
Exam 10: The Normal Distribution51 Questions
Exam 11: Inference for a Normal Population46 Questions
Exam 12: Comparing Two Means53 Questions
Exam 13: Handling Violations of Assumptions38 Questions
Exam 14: Designing Experiments56 Questions
Exam 15: Comparing Means of More Than Two Groups54 Questions
Exam 16: Correlation Between Numerical Variables49 Questions
Exam 17: Regression54 Questions
Exam 18: Multiple Explanatory Variables47 Questions
Exam 19: Computer-Intensive Methods25 Questions
Exam 20: Likelihood33 Questions
Exam 21: Meta-Analysis: Combining Information From38 Questions
Select questions type
When looking at a color map that uses colors to represent values, blue signifies larger values and red signifies smaller values.
(True/False)
4.8/5  (39)
(39)
When designing a table of data values, the rows should always be arranged such that the category with the largest number of values is at the top with the values descending until the last row has the smallest number of values.
(True/False)
4.8/5 (36)
What of the following is the best approach to deciding on the number of bins for a histogram?
(Multiple Choice)
4.8/5 (34)
Consider the data table that indicates how many subjects in a skin cancer study had various numbers of moles on their backs. Which of the histograms correctly depicts the data?
?
Frequency table showing the number of moles on the backs of 55 subjects.
Number of moles Number of subjects 0-5 15 6-10 22 11-15 7 16-20 8 21-25 3 ?
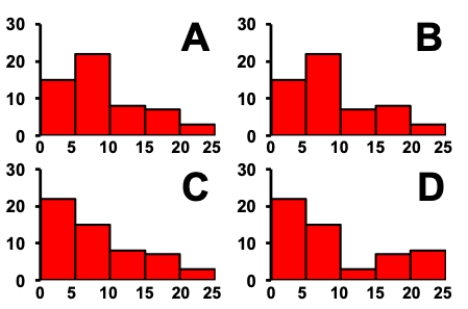 ?
?
(Multiple Choice)
4.8/5 (44)
If you saw a graph with rectangles standing on a horizontal axis, what is the best immediate visual clue to determine whether it is likely to be a well-designed bar chart or a histogram?
(Multiple Choice)
4.8/5 (38)
Consider the histogram shown. What two words describe the skew?
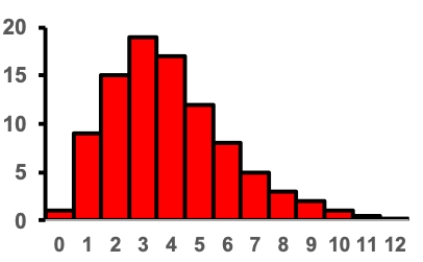
(Multiple Choice)
4.8/5 (32)
Consider the histogram of a data set shown. Which of the following values is the mode of the data set?
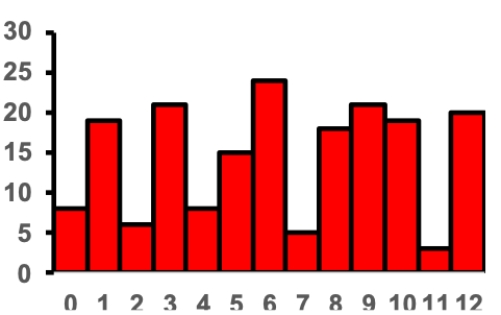
(Multiple Choice)
4.8/5 (29)
Consider an experiment in which rats are weighed and then their food consumption is measured. Which of the following terms would be used for the data point indicated with the arrow?
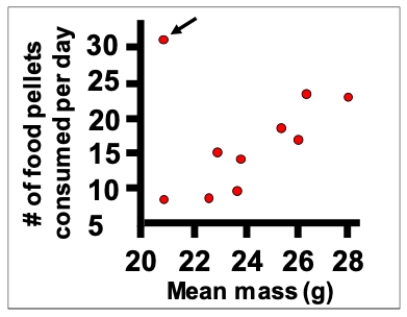
(Multiple Choice)
4.9/5 (35)
Essentially, all professional statistics software programs can read data files saved as .csv or text files, but not all will read Excel formats.
(True/False)
4.9/5 (38)
Distinguish between absolute and relative frequencies with regard to a data set.
(Short Answer)
5.0/5 (30)
Consider an experiment in which female and male rats are weighed and then their food consumption is measured. Which of the following is a flaw in the figure showing data from this experiment?
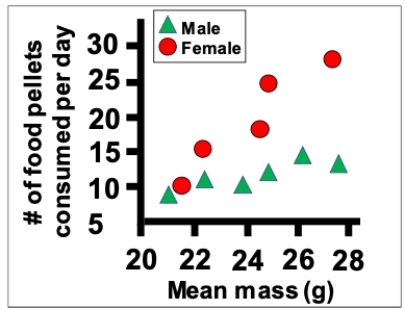
(Multiple Choice)
4.8/5 (31)
Which of the following is NOT a good thing to do when designing a data table?
(Multiple Choice)
4.7/5 (35)
Imagine you have length and weight data for two sets of mice: wildtype mice and ones with a genetic mutation for bone growths. Describe a scientific question using these mice that would be best analyzed with a scatter plot and a different question that would be best approached using a violin plot.
(Short Answer)
4.7/5 (40)
When designing a bar graph, which of the following is NOT something that should generally be done?
(Multiple Choice)
5.0/5 (32)
Consider an experiment in which rats are weighed and then their food consumption is measured. Which of the following terms is the best technical description of the data shown?
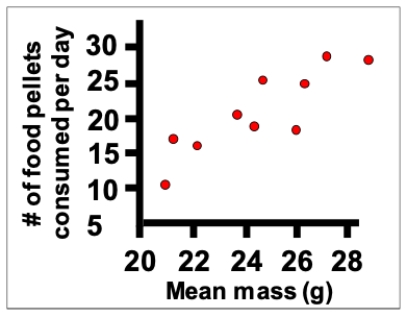
(Multiple Choice)
4.8/5 (39)
Filters
- Essay(0)
- Multiple Choice(0)
- Short Answer(0)
- True False(0)
- Matching(0)