Exam 31: Dealing With Multiple Data Sets or With Multiple Variables
Exam 1: Reasoning About Quantities34 Questions
Exam 2: Numeration Systems96 Questions
Exam 3: Understanding Whole Number Operations66 Questions
Exam 4: Some Conventional Ways of Computing17 Questions
Exam 5: Using Numbers in Sensible Ways38 Questions
Exam 6: Meanings for Fractions85 Questions
Exam 7: Computing With Fractions54 Questions
Exam 8: Multiplicative Comparisons and Multiplicative Reasoning19 Questions
Exam 9: Ratios, Rates, Proportions, and Percents33 Questions
Exam 10: Integers and Other Number Systems24 Questions
Exam 11: Number Theory57 Questions
Exam 12: What Is Algebra28 Questions
Exam 13: A Quantitative Approach to Algebra and Graphing18 Questions
Exam 14: Understanding Change: Relationships Among Time, Distance, and Rate10 Questions
Exam 15: Further Topics in Algebra and Change55 Questions
Exam 16: Polygons75 Questions
Exam 17: Polyhedra51 Questions
Exam 18: Symmetry17 Questions
Exam 19: Tessellations9 Questions
Exam 20: Similarity47 Questions
Exam 21: Curves, Constructions, and Curved Surfaces17 Questions
Exam 22: Transformation Geometry24 Questions
Exam 23: Measurement Basics21 Questions
Exam 24: Area, Surface Area, and Volume27 Questions
Exam 25: Counting Units Fast: Measurement Formulas31 Questions
Exam 26: Special Topics in Measurement21 Questions
Exam 27: Quantifying Uncertainty39 Questions
Exam 28: Determining More Complicated Probabilities37 Questions
Exam 29: Introduction to Statistics and Sampling7 Questions
Exam 30: Representing and Interpreting Data With One Variable32 Questions
Exam 31: Dealing With Multiple Data Sets or With Multiple Variables8 Questions
Exam 32: Variability in Samples21 Questions
Exam 33: Special Topics in Probability16 Questions
Select questions type
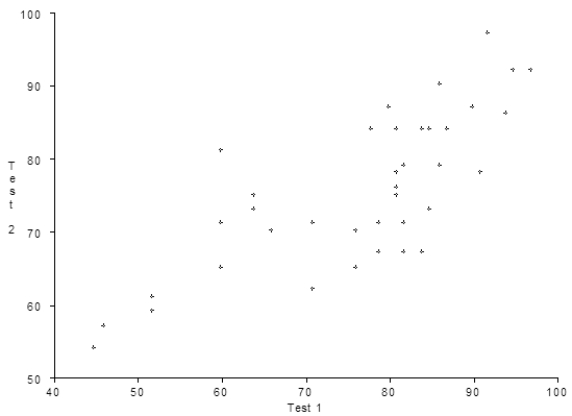
Below is a scatter plot of the test scores for two unrelated tests by the same students.
A) Are the two variables positively associated or negatively associated? Explain.
B) What might be a reason for that association?
C) Does the Test 1 score cause the Test 2 score?
Free
(Essay)
4.9/5  (37)
(37)
Correct Answer: Verified
A) The two variables are positively associated because higher scores on Test 1 tend to go with higher scores on Test 2.
B) Good students usually score well on all tests, and weaker students usually score poorly on all tests.
C) No, although there might be some psychological carryover in the degree of confidence for the student from Test 1 to Test 2.
Consider the following box plots for the scores on the same test by two different classes. 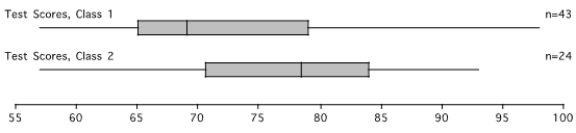 What can you tell about the classes and their performances from the box plots?
Free
(Essay)
4.9/5 (27)
Correct Answer:Verified
The median for Class 2 is greater than the median for Class 1. The scores for Class 1 are more spread out than those for Class 2. Even though Class 1 had the highest scorer(s), it appears that Class 2 tended to perform better.
Sketch a scatter plot of two variables that are clearly negatively associated. Label your axes and give their scales.
Free
(Short Answer)
4.8/5 (28)
Correct Answer:Verified
The sketch should show a general downward trend.
This rating chart of low-priced CD players is adapted from a Consumer Reports Buying Guide.
Onkyo DX-702 \ 185 88 Kenwood Dp-2030 \ 155 86 Philips CD40 \ 150 85 Pioneer PD-5700 \ 150 85 Sony CDP-491 \ 145 83 Technics SL-PG300 \ 170 83 JC XL-V241TN \ 135 79 Sears LXI \ 120 75 Optimus CD-1760 \ 120 74 Sharp DX R250 \ 130 74
A) Make a scatter plot of these data. Choose your scales carefully.
B) Are the two variables positively correlated? Explain how you know.
C) An equation for the line of best fit is y = 0.22x + 49. Use the equation to estimate the cost of a CD with a rating of 100.
(Essay)
4.8/5 (31)
Predict whether the correlation coefficient for each of the following pairs of variables is close to +1, -1, or 0. Explain your answers.
A) the consumption of ice cream and the outside temperature
B) the age of an adult smoker and the number of cigarettes smoked each day
C) the height of an elementary school child and his/her age
D) the mean weight of a Grade 2 class and the number of children in the class
(Essay)
4.9/5 (34)
Below are the histograms for the test scores for two tests (for the same class). 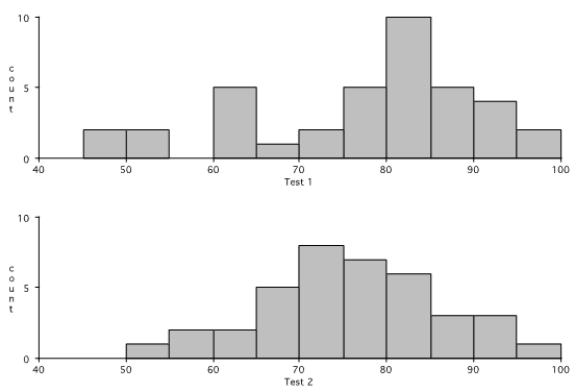 What can you tell about the performances on the two tests from the histograms?
(Essay)
4.8/5 (28)
Below are the box plots for the test scores for two tests (for the same class). 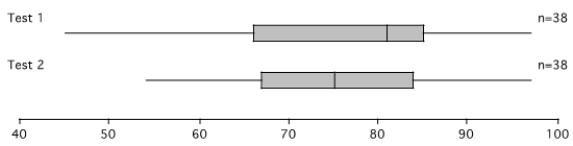 What can you tell about the performances on the two tests from the box plots?
(Essay)
4.8/5 (34)
Consider the following histograms for the scores on the same test by two different classes. 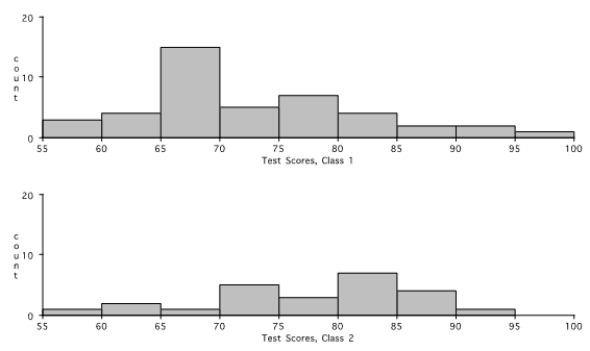 What can you tell about the classes and their performances from the histograms?
(Essay)
4.9/5 (34)
Filters
- Essay(0)
- Multiple Choice(0)
- Short Answer(0)
- True False(0)
- Matching(0)