Exam 30: Representing and Interpreting Data With One Variable
Exam 1: Reasoning About Quantities34 Questions
Exam 2: Numeration Systems96 Questions
Exam 3: Understanding Whole Number Operations66 Questions
Exam 4: Some Conventional Ways of Computing17 Questions
Exam 5: Using Numbers in Sensible Ways38 Questions
Exam 6: Meanings for Fractions85 Questions
Exam 7: Computing With Fractions54 Questions
Exam 8: Multiplicative Comparisons and Multiplicative Reasoning19 Questions
Exam 9: Ratios, Rates, Proportions, and Percents33 Questions
Exam 10: Integers and Other Number Systems24 Questions
Exam 11: Number Theory57 Questions
Exam 12: What Is Algebra28 Questions
Exam 13: A Quantitative Approach to Algebra and Graphing18 Questions
Exam 14: Understanding Change: Relationships Among Time, Distance, and Rate10 Questions
Exam 15: Further Topics in Algebra and Change55 Questions
Exam 16: Polygons75 Questions
Exam 17: Polyhedra51 Questions
Exam 18: Symmetry17 Questions
Exam 19: Tessellations9 Questions
Exam 20: Similarity47 Questions
Exam 21: Curves, Constructions, and Curved Surfaces17 Questions
Exam 22: Transformation Geometry24 Questions
Exam 23: Measurement Basics21 Questions
Exam 24: Area, Surface Area, and Volume27 Questions
Exam 25: Counting Units Fast: Measurement Formulas31 Questions
Exam 26: Special Topics in Measurement21 Questions
Exam 27: Quantifying Uncertainty39 Questions
Exam 28: Determining More Complicated Probabilities37 Questions
Exam 29: Introduction to Statistics and Sampling7 Questions
Exam 30: Representing and Interpreting Data With One Variable32 Questions
Exam 31: Dealing With Multiple Data Sets or With Multiple Variables8 Questions
Exam 32: Variability in Samples21 Questions
Exam 33: Special Topics in Probability16 Questions
Select questions type
The standard deviations for the test scores for two classes are quite different (on the same test). What does that tell you?
(Essay)
4.9/5  (26)
(26)
A) Make a box plot for the exam scores.
B) Give the five-number summary for the scores.
C) What is the 90th percentile for these scores?
D) Are there any outliers?
E) Make a stem-and-leaf plot for the test scores.
F) Make a histogram for the test scores.
Use a cell width of 5 points.
Exam scores Exam scores, ordered 25 81 65 78 64 77 46 75 38 70 58 68 44 68 65 67 60 66 50 66 70 65 55 65 44 64 68 62 67 60 66 59 66 58 81 55 68 53 51 51 51 51 75 50 53 49 47 47 62 46 59 44 32 44 78 38 49 32 77 25
(Essay)
4.9/5 (32)
A particular medicine is not effective if there is less than 147 milligrams of Xylz in a dose, and the medicine is dangerous if there is more than 153 milligrams of Xylz in a dose. One manufacturer of the medicine uses a process that gives medicine with a normally distributed strength of Xylz, with mean 150 milligrams and standard deviation 1.5 milligrams of Xylz per dose. Approximately what percent of the manufacturer's total production will be thrown out and not used because of effectiveness or safety reasons?
(Essay)
4.8/5 (32)
Suppose that the class mean on a test is 81.2%. What does the 81.2% mean (not how it was calculated)?
(Essay)
4.9/5 (36)
The median, rather than the mean or mode, is often given in reports about house prices. Why is that?
(Essay)
4.9/5 (43)
Calculate the standard deviation for these scores: 80, 72, 80, and 88. Show your work for credit.
(Essay)
4.8/5 (26)
Of the 1000 scores on a test, 250 scores will be in the second and third quartiles.
(True/False)
4.8/5 (38)
Make a box-and-whiskers plot for these 24 scores, and give the five-number summary.
20, 19, 19, 18, 21, 20, 20, 17, 19, 21, 21, 19, 22, 18, 21, 19, 18, 22, 18, 19, 21, 21, 19, 20
Tell what each number in the five-number summary represents.
(Essay)
4.9/5 (39)
Box-and-whiskers plots for a sample of students and their number of hours of sleep per night during the week are given below. (Data adapted from DataScope.)
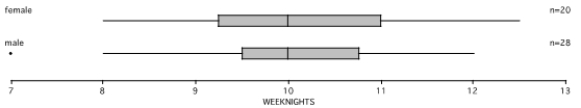 A) Why is the one dot for a male student separate from the rest of the graph?
B) How many female students sleep more than 11 hours?
C) How many male students sleep between 10 and 10.75 hours?
D) Do any females sleep longer than all the males? Explain.
E) Give the interquartile range for the males.
F) Give the five-number summary for the females.
G) If the female and male data were put together, what would be the median number of hours of sleep? Explain how you know or why you can't tell.
A) Why is the one dot for a male student separate from the rest of the graph?
B) How many female students sleep more than 11 hours?
C) How many male students sleep between 10 and 10.75 hours?
D) Do any females sleep longer than all the males? Explain.
E) Give the interquartile range for the males.
F) Give the five-number summary for the females.
G) If the female and male data were put together, what would be the median number of hours of sleep? Explain how you know or why you can't tell.
(Essay)
4.8/5 (34)
Make a bar graph for the following data about favorite color. Use as much of the grid as you need, but do not add any squares. Be sure to give all labels.
Blue: 18 students Red: 12 students Green: 6 students Orange: 4 students
(Essay)
4.8/5 (33)
The mean is affected more by an extreme value than the median is.
(True/False)
4.9/5 (40)
Filters
- Essay(0)
- Multiple Choice(0)
- Short Answer(0)
- True False(0)
- Matching(0)