Exam 10: The Tools of Quality
Exam 1: Differing Perspectives on Quality119 Questions
Exam 2: Quality Theory90 Questions
Exam 3: Global Supply Chain Quality and International Quality Standards100 Questions
Exam 4: Strategic Quality Planning91 Questions
Exam 5: The Voice of the Customer100 Questions
Exam 6: The Voice of the Market90 Questions
Exam 7: Quality and Innovation in Product and Process Design93 Questions
Exam 8: Designing Quality Services90 Questions
Exam 9: Managing Supplier Quality in the Supply Chain65 Questions
Exam 10: The Tools of Quality90 Questions
Exam 11: Statistically Based Quality Improvement for Variables105 Questions
Exam 12: Statistically Based Quality Improvement for Attributes90 Questions
Exam 13: Six Sigma Management and Lean Tools90 Questions
Exam 14: Managing Quality Improvement Teams and Projects91 Questions
Exam 15: Implementing and Validating the Quality System70 Questions
Select questions type
With reference to the language of process maps, a ________ is used whenever materials, forms, or tools enter or leave the process.
Free
(Multiple Choice)
4.9/5  (34)
(34)
Correct Answer: Verified
E
A prioritization grid is used to make decisions based on a single criterion.
Free
(True/False)
5.0/5 (31)
Correct Answer:Verified
False
The RC and More Superstore decides to track customer complaints as part of their ongoing customer satisfaction improvement program. After collecting data for two months, their check sheet appears as follows: 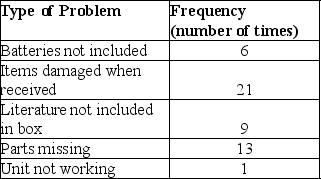 If they construct a Pareto chart, what is the cumulative percentage of the two leftmost bars?
Free
(Multiple Choice)
4.9/5 (27)
Correct Answer:Verified
D
The first step in process mapping is to settle on a standard set of process mapping symbols to be used.
(True/False)
4.8/5 (51)
________ are graphs that present multiple metrics simultaneously in a two-dimensional plane.
(Multiple Choice)
4.9/5 (46)
Cletus Inc. plans to overhaul the cafeteria menu and has formed a four-person team to evaluate alternatives. The team identifies four criteria and has ranked the Price criteria as shown in the table below: 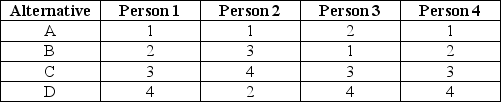 What is the final price ranking for alternative B?
(Multiple Choice)
4.9/5 (36)
The cause-and-effect diagram is used to move to lower levels of abstraction in solving problems.
(True/False)
4.7/5 (33)
Histograms are simply graphical representations of data in a pie chart format.
(True/False)
4.9/5 (36)
A ________ determines the parameters for process improvement.
(Multiple Choice)
4.9/5 (27)
The activity network diagram is also known as a PERT diagram or critical-path diagram and is used in controlling projects.
(True/False)
4.8/5 (32)
Define a tree diagram and describe the steps used to complete a tree diagram.
(Essay)
4.8/5 (29)
The usefulness of the balanced scorecard comes from integrating financial measures of business success along with nonfinancial, operational information about the business.
(True/False)
5.0/5 (38)
State the importance of balanced scorecards in measuring performance.
(Essay)
4.7/5 (33)
Which of the following is one of the new seven tools for management?
(Multiple Choice)
4.9/5 (34)
In a process map, a parallelogram appears whenever materials, forms, or tools enter or leave the process.
(True/False)
4.9/5 (31)
The matrix diagram is similar in concept to quality function deployment in its use of symbols, its layout, and its application.
(True/False)
4.8/5 (34)
________ are usually spreadsheets that are communicated to management on a regular basis-weekly, monthly, quarterly, and annually.
(Multiple Choice)
4.8/5 (30)
Filters
- Essay(0)
- Multiple Choice(0)
- Short Answer(0)
- True False(0)
- Matching(0)