Exam 11: Statistically Based Quality Improvement for Variables
Exam 1: Differing Perspectives on Quality119 Questions
Exam 2: Quality Theory90 Questions
Exam 3: Global Supply Chain Quality and International Quality Standards100 Questions
Exam 4: Strategic Quality Planning91 Questions
Exam 5: The Voice of the Customer100 Questions
Exam 6: The Voice of the Market90 Questions
Exam 7: Quality and Innovation in Product and Process Design93 Questions
Exam 8: Designing Quality Services90 Questions
Exam 9: Managing Supplier Quality in the Supply Chain65 Questions
Exam 10: The Tools of Quality90 Questions
Exam 11: Statistically Based Quality Improvement for Variables105 Questions
Exam 12: Statistically Based Quality Improvement for Attributes90 Questions
Exam 13: Six Sigma Management and Lean Tools90 Questions
Exam 14: Managing Quality Improvement Teams and Projects91 Questions
Exam 15: Implementing and Validating the Quality System70 Questions
Select questions type
In a variables control chart, which of the following is likely to occur if seven points, either increasing or decreasing, are in succession?
Free
(Multiple Choice)
4.9/5  (33)
(33)
Correct Answer: Verified
C
The moving average chart uses past information to predict what the next process outcome will be.
Free
(True/False)
4.8/5 (42)
Correct Answer:Verified
True
Random variation is also referred to as uncontrollable variation.
Free
(True/False)
4.8/5 (35)
Correct Answer:Verified
True
A ________ subgroup is a group of data that is logically homogeneous.
(Multiple Choice)
4.8/5 (41)
________ refers to the ability of a process to produce a product that meets specifications.
(Multiple Choice)
4.9/5 (25)
________ is based on the concept that all work occurs in a system of interconnected processes.
(Multiple Choice)
4.8/5 (25)
________ is a decision-making skill demonstrated by the ability to draw conclusions based on data.
(Multiple Choice)
4.9/5 (38)
In a variables control chart, which of the following is likely to occur if large jumps of more than three or four standard deviations take place?
(Multiple Choice)
4.9/5 (33)
Proportion defective, number defective, number nonconforming in a consistent sample space, and number defects per unit are examples of ________.
(Multiple Choice)
4.7/5 (31)
Process population average, mean, range, moving range, and standard deviation are examples of ________.
(Multiple Choice)
4.8/5 (41)
The first step in developing process control charts is to identify critical product characteristics.
(True/False)
4.8/5 (31)
________ is the probability that a good product will be rejected.
(Multiple Choice)
4.8/5 (26)
Statistical thinking is a decision-making skill demonstrated by the ability to draw conclusions based on data.
(True/False)
4.9/5 (33)
Use the following table to answer the question(s) below.
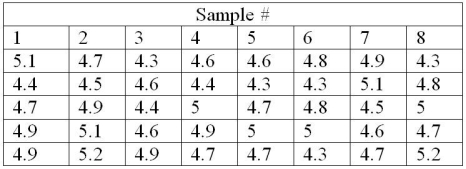 -A machine shop owner wishes to monitor the diameter of an engine boring operation where the piston bore should be 4.25". He obtains 8 samples of 5 and records the data in the table above. What should the center line be for a chart that monitors process average?
(Multiple Choice)
4.8/5 (32)
If it is too time consuming or inconvenient to compute subgroup averages, a median chart should be used.
(True/False)
4.9/5 (35)
Filters
- Essay(0)
- Multiple Choice(0)
- Short Answer(0)
- True False(0)
- Matching(0)