Exam 14: Inference About Simple Regression
Exam 1: Statistics Success Stories and Cautionary Tales79 Questions
Exam 2: Turning Data Into Information94 Questions
Exam 3: Relationships Between Quantitative Variables99 Questions
Exam 4: Relationships Between Categorical Variables100 Questions
Exam 5: Sampling: Surveys and How to Ask Questions109 Questions
Exam 6: Gathering Useful Data for Examining Relationships90 Questions
Exam 7: Probability112 Questions
Exam 8: Random Variables115 Questions
Exam 9: Understanding Sampling Distributions: Statistics As Random Variables231 Questions
Exam 10: Estimating Proportions With Confidence104 Questions
Exam 11: Estimating Means With Confidence103 Questions
Exam 12: Testing Hypotheses About Proportions139 Questions
Exam 13: Testing Hypotheses About Means166 Questions
Exam 14: Inference About Simple Regression115 Questions
Exam 15: More About Inference for Categorical Variables111 Questions
Exam 16: Analysis of Variance111 Questions
Exam 17: Turning Information Into Wisdom70 Questions
Select questions type
Shown below is a scatterplot of y versus x. 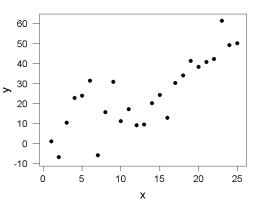 Which choice is most likely to be the approximate value of r2, the proportion of variation in y explained by the linear relationship with x?
(Multiple Choice)
4.8/5  (35)
(35)
Use the following information for questions:
A sample of 19 female bears was measured for chest girth (y) and neck girth (x), both in inches. The least squares regression equation relating the two variables is = 5.32 + 1.53 x. The standard deviation of the regression is s = 3.692.
-What is a 95% confidence interval for the average (or mean) chest girth for bears with a neck girth of 18 inches? The standard error of the fit, s.e.(fit), = 0.860.
(Multiple Choice)
4.8/5 (33)
Use the following information for questions:
A representative sample of n = 12 male college students is used to find a regression equation for y = weight (lbs) and x = height (inches). The least squares regression equation is = 30 + 2 x. The standard error of the estimated slope is 1. The following hypotheses will be tested:
H0:
Ha:
-What is the value of the t-statistic for testing these hypotheses?
(Multiple Choice)
4.8/5 (28)
Use the following information for questions:
A car salesman is curious if he can predict the fuel efficiency of a car (in MPG) if he knows the fuel capacity of the car (in gallons). He collects data on a variety of makes and models of cars. The scatterplot shows that a linear model is appropriate. SPSS output is provided below.
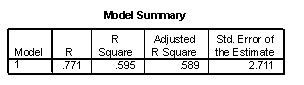
 -What is the numerical value of the correlation coefficient between fuel efficiency and fuel capacity?
(Short Answer)
4.8/5 (28)
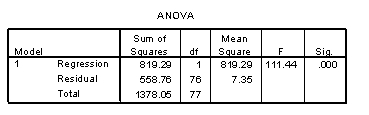
Use the following information for questions:
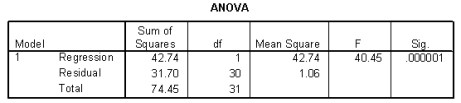
A car salesman is curious if he can predict the fuel efficiency of a car (in MPG) if he knows the fuel capacity of the car (in gallons). He collects data on a variety of makes and models of cars. The scatterplot shows that a linear model is appropriate. SPSS output is provided below.
-To assess if there is a significant linear relationship between fuel efficiency and fuel capacity, what are the hypotheses to be tested?
(Short Answer)
4.9/5 (33)
Use the following information for questions:
A representative sample of n = 12 male college students is used to find a regression equation for y = weight (lbs) and x = height (inches). The least squares regression equation is = 30 + 2 x. The standard error of the estimated slope is 1. The following hypotheses will be tested:
H0:
Ha:
-What is the p-value for the test? (Table A.3 or its equivalent needed.)
(Multiple Choice)
4.8/5 (38)
Use the following information for questions:
Data has been obtained on the house size (in square feet) and the selling price (in dollars) for a sample of 100 homes in your town. Your friend is saving to buy a house and she asks you to investigate the relationship between house size and selling price and to develop a model to predict the price from size.
-Predict the price for the 60th observed house, which had a home size of 2430 square feet.
(Short Answer)
4.8/5 (37)
Use the following information for questions:
Grades for a random sample of students who have taken statistics from a certain professor over the past 20 year were used to estimate the relationship between y = grade on the final exam and x = average exam score (for the three exams given during the term). 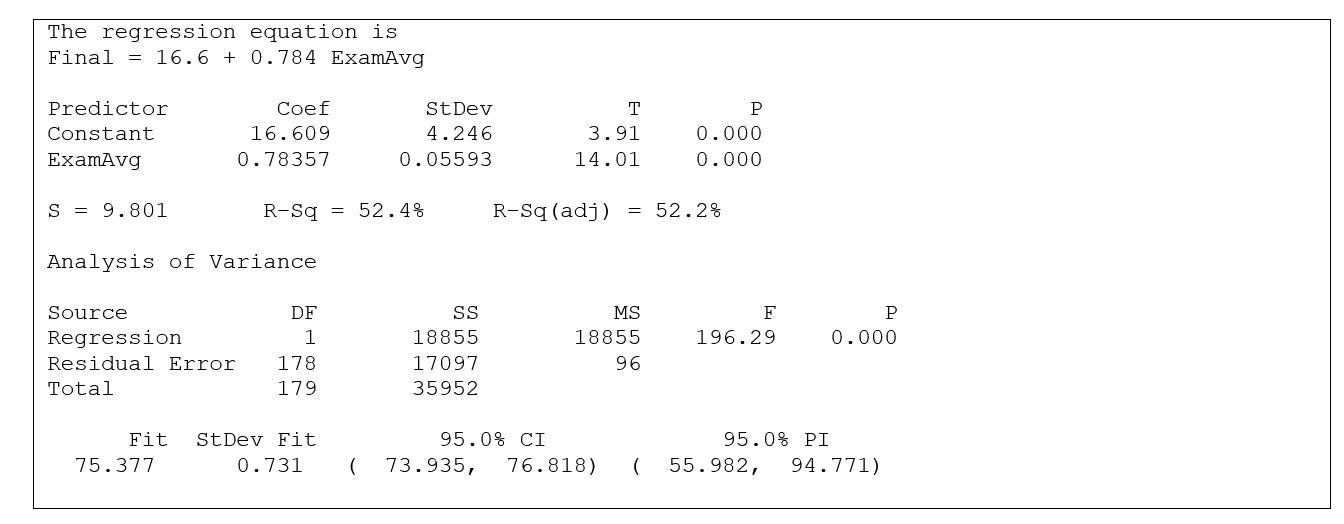 -The "Fit"information shown at the end of the output is for ExamAvg = 75. From this, we can conclude that
(Multiple Choice)
4.8/5 (35)
Use the following information for questions:
Based on a representative sample of college men, a regression line relating y = ideal weight tox = actual weight, for men, is given by
Ideal weight = 53 + 0.7 *actual weight
-For a man with actual weight = 200 pounds, his ideal weight is predicted to be
(Multiple Choice)
4.8/5 (45)
Use the following information for questions:
A consumer agency employee has been researching and testing food products for months. He is convinced that the dimensions of the packaging used for dry goods (crackers, cookies, cereal, etc) all satisfy a certain ratio. He will try to model the relationship between the minimum width of a box and the height of the box, to see if he can predict the height of the box from the minimum width (both measured in inches). Data is collected on 24 randomly selected products. The scatterplot shows that a linear model is appropriate. (Partial) SPSS output is provided below.
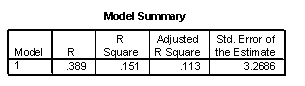
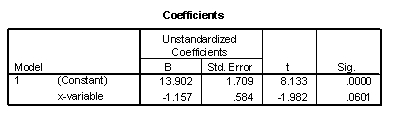 -The residual plot is supplied below.
 Based on the residual plot, is there any evidence that one of the assumptions for a linear regression model does not hold? Explain.
(Essay)
4.7/5 (40)
Which choice is not an appropriate description of in a regression equation?
(Multiple Choice)
4.9/5 (37)
Use the following information for questions:
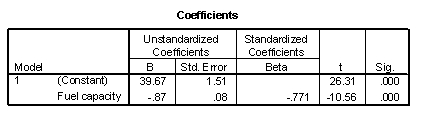
A car salesman is curious if he can predict the fuel efficiency of a car (in MPG) if he knows the fuel capacity of the car (in gallons). He collects data on a variety of makes and models of cars. The scatterplot shows that a linear model is appropriate. SPSS output is provided below.
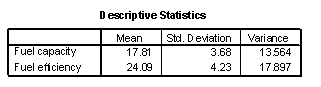
-Calculate a 98% confidence interval for the average fuel efficiency for all cars that hold 18 gallons of fuel. Descriptive statistics for the two variables are provided below. Use the mean to obtain and the variance to calculate  . Use these two values then to calculate s.e.(fit).
(Short Answer)
4.9/5 (35)
Use the following information for questions:
The heights (in inches) and foot lengths (in centimeters) of 32 college men were used to develop a model for the relationship between height and foot length. The scatterplot shows that a linear model is appropriate. SPSS output is provided below. 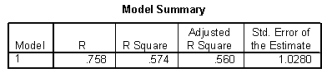
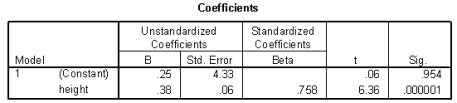 -How much would you expect foot length to increase for each 1-inch increase in height? Include the units.
(Short Answer)
4.7/5 (33)
Use the following information for questions:
The relation between y = ideal weight (lbs) and x =actual weight (lbs), based on data fromn = 119 women, resulted in the regression line = 44 + 0.60 x
-The intercept of the regression line is ______
(Multiple Choice)
4.8/5 (40)
Shown below are four residual plots (residuals versus predicted values). Which one of the four does not show any evidence that one of the assumptions for a linear regression model is violated? 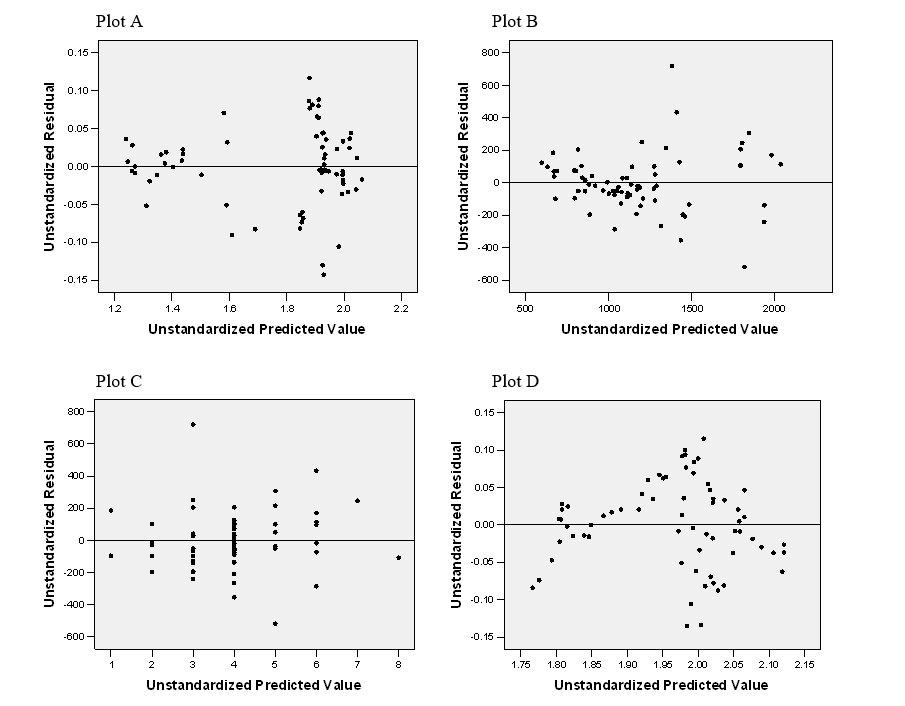
(Short Answer)
4.8/5 (40)
Use the following information for questions:
A regression line relating y = hours of sleep the previous day to x =hours studied the previous day is estimated using data from n = 10 students. The estimated slope b1 = -0.30. The standard error of the slope is s.e.(b1) = 0.20.
-What is a 90% confidence interval for 1 , the population slope?
(Short Answer)
4.7/5 (25)
In a statistics class at Penn State University, a group working on a project recorded the time it took each of 20 students to drink a 12-ounce beverage and also recorded body weights for the students. Which of these statistical techniques would be the most appropriate for determining if there is a statistically significant relationship between drinking time and body weight? (Assume that the necessary conditions for the correct procedure are met.)
(Multiple Choice)
4.8/5 (37)
Use the following information for questions:
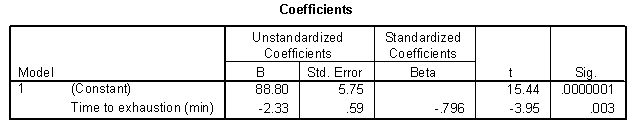
Can an athlete's cardiovascular fitness (as measured by time to exhaustion on a treadmill) help to predict the athlete's performance in a 20k ski race? To address this question the time to exhaustion on a treadmill (minutes) and the time to complete a 20k ski race (minutes) were recorded for a sample of 11 athletes. The researcher hypothesizes that there would be an inverse linear relationship, that is, the longer the time to exhaustion, the faster the athlete's time in the 20k ski race, on average. The data were used to provide the following output. 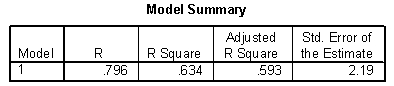
 -Below are two intervals, one is the 95% prediction interval for the ski time for the 7th skier and the other is the 95% confidence interval for the mean ski time for all skiers with a treadmill exhaustion time of 10 minutes. Which of the following is the prediction interval?
Interval 1: (63.9, 67.0) Interval 2: (60.3, 70.7)
-Below are two intervals, one is the 95% prediction interval for the ski time for the 7th skier and the other is the 95% confidence interval for the mean ski time for all skiers with a treadmill exhaustion time of 10 minutes. Which of the following is the prediction interval?
Interval 1: (63.9, 67.0) Interval 2: (60.3, 70.7)
(Short Answer)
4.8/5 (34)
Use the following information for questions:
A regression line relating y = hours of sleep the previous day to x =hours studied the previous day is estimated using data from n = 10 students. The estimated slope b1 = -0.30. The standard error of the slope is s.e.(b1) = 0.20.
-What is the value of the test statistic for the following hypothesis test about , the population slope?
H0:
Ha:
(Short Answer)
4.8/5 (35)
Use the following information for questions:
The relation between y = ideal weight (lbs) and x =actual weight (lbs), based on data fromn = 119 women, resulted in the regression line = 44 + 0.60 x
-What is the interpretation of the value 44 in the regression for this question?
(Multiple Choice)
4.9/5 (34)
Filters
- Essay(0)
- Multiple Choice(0)
- Short Answer(0)
- True False(0)
- Matching(0)