Exam 2: Turning Data Into Information
Exam 1: Statistics Success Stories and Cautionary Tales79 Questions
Exam 2: Turning Data Into Information94 Questions
Exam 3: Relationships Between Quantitative Variables99 Questions
Exam 4: Relationships Between Categorical Variables100 Questions
Exam 5: Sampling: Surveys and How to Ask Questions109 Questions
Exam 6: Gathering Useful Data for Examining Relationships90 Questions
Exam 7: Probability112 Questions
Exam 8: Random Variables115 Questions
Exam 9: Understanding Sampling Distributions: Statistics As Random Variables231 Questions
Exam 10: Estimating Proportions With Confidence104 Questions
Exam 11: Estimating Means With Confidence103 Questions
Exam 12: Testing Hypotheses About Proportions139 Questions
Exam 13: Testing Hypotheses About Means166 Questions
Exam 14: Inference About Simple Regression115 Questions
Exam 15: More About Inference for Categorical Variables111 Questions
Exam 16: Analysis of Variance111 Questions
Exam 17: Turning Information Into Wisdom70 Questions
Select questions type
Use the following information for questions:
Suppose that the average number of years to graduate at a university is 4 years, with a standard deviation of 0.5 years. Assume a bell-shaped distribution for years to graduate.
-From the Empirical Rule, what is a range of values that 95% of the students should graduate between?
(Short Answer)
4.9/5  (38)
(38)
Use the following information for questions:
In a survey of 1000 adults, respondents were asked about the expense of a college education and the relative necessity of financial assistance. The correspondents were classified as to whether they currently had a child in college or not (college status), and whether they thought the loan obligation for most college students was too high, about right, or too little (loan obligation opinion). The table below summarizes some of the survey results. Use these results to answer the following questions. 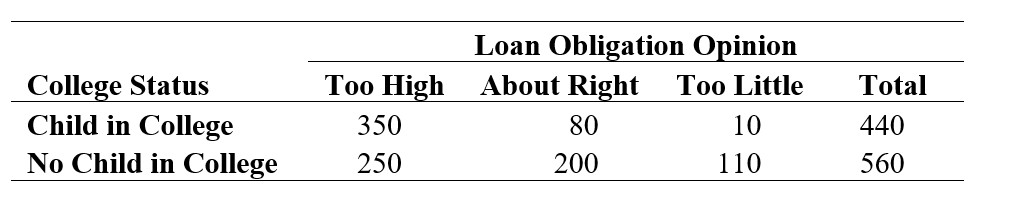 -Which type of variable is Loan Obligation Opinion?
(Multiple Choice)
4.9/5 (40)
Use the following information for questions:
The following histogram is for the weights (lbs) of 119 female college students.(Source: idealwtwomen dataset on the CD.) 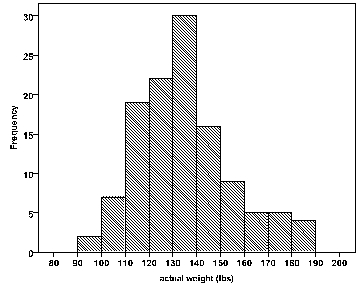 -What is the approximate shape of the distribution?
(Multiple Choice)
4.7/5 (28)
Scores on an achievement test averaged 70 with a standard deviation of 10. Serena's score was 85. What was her standardized score (also called a z-score)?
(Multiple Choice)
4.9/5 (36)
Use the following information for questions:
Suppose that the average number of years to graduate at a university is 4 years, with a standard deviation of 0.5 years. Assume a bell-shaped distribution for years to graduate.
-From the Empirical Rule, what is a range of values that 99.7% of the students should graduate between?
(Short Answer)
4.8/5 (28)
Which of the following could account for an outlier in a dataset?
(Multiple Choice)
4.7/5 (34)
The table below summarizes observed data on the gender and party membership of 1000 individuals:
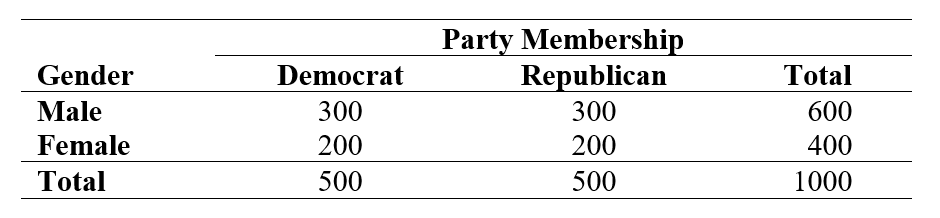 Which one of the following statements about the relationship between gender and party is suggested by the data in the table?
(Multiple Choice)
4.7/5 (38)
What is a reasonable action if an outlier is a legitimate data value and represents natural variability for the group and variable measured?
(Short Answer)
4.9/5 (32)
Use the following information for questions:
A psychologist has developed a new technique intended to improve rote memory. To test the method against other standard methods, 45 high school students are selected at random and each is taught the new technique. The data on the number of words memorized correctly by the students were used to create the following histogram. Note the first class represents the interval [70, 72). 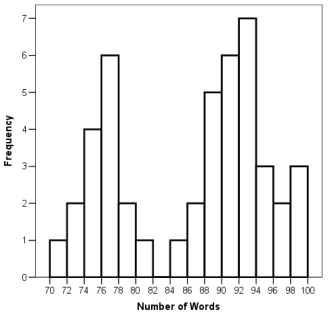 -What is the overall shape of the distribution of the number of memorized words for these students?
(Short Answer)
4.8/5 (33)
Use the following information for questions:
The following boxplot gives the distribution of the ratings of a new brand of peanut butter for 50 randomly selected consumers (100 points possible with higher points corresponding to a more favorable rating). 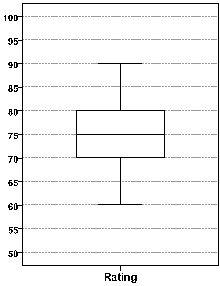 -The lower quartile is between
(Multiple Choice)
4.9/5 (35)
Suppose that the average height for college men is 66 inches. If the height distribution is bell-shaped, and 95% of the men have heights between 60 inches and 72 inches, what is the standard deviation of heights for this population?
(Short Answer)
4.9/5 (30)
Use the following information for questions:
According to a national sleep foundation survey, around 31 million Americans are sleep deprived. They also say women need more sleep than men and are being short-changed. Below are the five number summaries for the number of hours of sleep at night based on a survey of American men and women.
Men: 5.5, 6, 6.5, 7.5, 9
Women: 4.5, 5, 6, 7, 8
-What percent of women sleep at least 6 hours at night? What percent of men do so?
(Short Answer)
4.8/5 (41)
The mean hours of sleep that students get per night is 7 hours, the standard deviation of hours of sleep is 1.7 hours, and the distribution is approximately normal. Complete the following sentence. For about 95% of students, nightly amount of sleep is between ______.
(Multiple Choice)
4.8/5 (32)
Use the following information for questions:
The average rainfall during the month of November in San Francisco, California, is 2.62 inches. The standard deviation is 2.79 inches.
-What is the standardized score (z-score) for 11.78 inches, the rainfall in San Francisco during November 1885?
(Short Answer)
4.8/5 (36)
The percent of data which lie between the lower and upper quartiles is
(Multiple Choice)
4.8/5 (28)
Which of the following is true about the relationship between the standard deviation s and the range for a large bell-shaped data set?
(Multiple Choice)
4.7/5 (27)
Use the following information for questions:
In a survey of 1000 adults, respondents were asked about the expense of a college education and the relative necessity of financial assistance. The correspondents were classified as to whether they currently had a child in college or not (college status), and whether they thought the loan obligation for most college students was too high, about right, or too little (loan obligation opinion). The table below summarizes some of the survey results. Use these results to answer the following questions.
-Which group had the greatest percentage of adults who thought loan obligations are too high?
(Multiple Choice)
4.8/5 (38)
Use the following information for questions:
Suppose that amount spent by students on textbooks this semester has approximately a bell-shaped distribution. The mean amount spent was $300 and the standard deviation is $100.
-A student spent $500 on textbooks. What percentile does their value correspond to?
(Multiple Choice)
4.8/5 (32)
If an exam was worth 100 points, and your score was at the 80th percentile, then
(Multiple Choice)
4.8/5 (29)
Filters
- Essay(0)
- Multiple Choice(0)
- Short Answer(0)
- True False(0)
- Matching(0)