Exam 2: Turning Data Into Information
Exam 1: Statistics Success Stories and Cautionary Tales79 Questions
Exam 2: Turning Data Into Information94 Questions
Exam 3: Relationships Between Quantitative Variables99 Questions
Exam 4: Relationships Between Categorical Variables100 Questions
Exam 5: Sampling: Surveys and How to Ask Questions109 Questions
Exam 6: Gathering Useful Data for Examining Relationships90 Questions
Exam 7: Probability112 Questions
Exam 8: Random Variables115 Questions
Exam 9: Understanding Sampling Distributions: Statistics As Random Variables231 Questions
Exam 10: Estimating Proportions With Confidence104 Questions
Exam 11: Estimating Means With Confidence103 Questions
Exam 12: Testing Hypotheses About Proportions139 Questions
Exam 13: Testing Hypotheses About Means166 Questions
Exam 14: Inference About Simple Regression115 Questions
Exam 15: More About Inference for Categorical Variables111 Questions
Exam 16: Analysis of Variance111 Questions
Exam 17: Turning Information Into Wisdom70 Questions
Select questions type
Use the following information for questions:
Listed below is a stem-and-leaf plot of the times it took 13 students to drink a 12 ounce beverage. Values for stems represent seconds and values for leaves represent tenths of a second.
3| 1234
3| 5
4| 0
5| 6
6| 11379
7|
8| 2
-The lower quartile is
(Multiple Choice)
4.8/5  (31)
(31)
The head circumference (in centimeters) of 15 college-age males was obtained, resulting in the following measurements: 55, 56, 56, 56.5, 57, 57, 57, 57.5, 58, 58, 58, 58.5, 59, 59, 63. If the last measurement (63 cm's) were incorrectly recorded as 73, which one of the following statistics would change?
(Multiple Choice)
4.8/5 (38)
Use the following information for questions:
A five-number summary given in Case Study 1.1 for the fastest ever driving speeds reported by 102 women was: 30, 80, 89, 95, 130.
-Fill in the blank in the following sentence: Approximately 25% of the women reported a fastest ever driving speed of at most _____ mph.
(Multiple Choice)
4.9/5 (34)
Use the following information for questions:
Suppose that amount spent by students on textbooks this semester has approximately a bell-shaped distribution. The mean amount spent was $300 and the standard deviation is $100.
-What amount spent on textbooks has a standardized score equal to 0.5?
(Multiple Choice)
4.8/5 (34)
By inspection, determine which of the following sets of numbers has the smallest standard deviation.
(Multiple Choice)
4.7/5 (38)
Use the following information for questions:
The following boxplot gives the distribution of the ratings of a new brand of peanut butter for 50 randomly selected consumers (100 points possible with higher points corresponding to a more favorable rating). 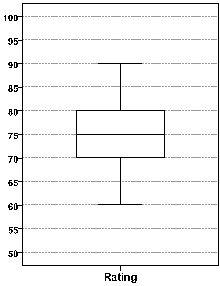 -The median is
(Multiple Choice)
4.8/5 (41)
Which one of the following summary statistics is not a measure of the variation (spread) in a data set?
(Multiple Choice)
4.8/5 (35)
Use the following information for questions:
A USA TODAY/CNN/Gallup Poll conducted April 19, 2005, was based on telephone interviews with 616 U.S. Catholics. One question asked was "When you think about your commitment to the Catholic Church, how much is your commitment affected by who the pope is -- a great deal, a moderate amount, not much, or not at all? The percentages are provided in the table below.  -Approximately how many respondents stated that their commitment is not affected much?
(Short Answer)
4.9/5 (41)
Use the following information for questions:
Suppose that the average number of years to graduate at a university is 4 years, with a standard deviation of 0.5 years. Assume a bell-shaped distribution for years to graduate.
-From the Empirical Rule, what is a range of values that 68% of the students should graduate between?
(Short Answer)
4.9/5 (30)
Use the following information for questions:
According to a national sleep foundation survey, around 31 million Americans are sleep deprived. They also say women need more sleep than men and are being short-changed. Below are the five number summaries for the number of hours of sleep at night based on a survey of American men and women.
Men: 5.5, 6, 6.5, 7.5, 9
Women: 4.5, 5, 6, 7, 8
-Write a sentence to compare men versus women in terms of the median amount of sleep at night
(Short Answer)
4.8/5 (29)
Use the following information for questions:
The table below provides a statistical summary of the number of CDs owned as reported by students in a class survey done at Penn State University.
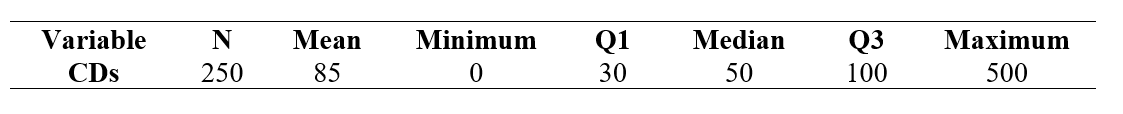 -What is the interquartile range for these data?
(Multiple Choice)
4.8/5 (33)
Use the following information for questions:
Suppose that amount spent by students on textbooks this semester has approximately a bell-shaped distribution. The mean amount spent was $300 and the standard deviation is $100.
-What percent of students spent more than $350?
(Multiple Choice)
4.7/5 (27)
Use the following information for questions:
The following boxplot gives the distribution of the ratings of a new brand of peanut butter for 50 randomly selected consumers (100 points possible with higher points corresponding to a more favorable rating).
-Based on the boxplot,
(Multiple Choice)
4.9/5 (39)
Use the following information for questions:
The pie chart below shows the U.S. Energy Consumption by Energy Source for the year 2009. 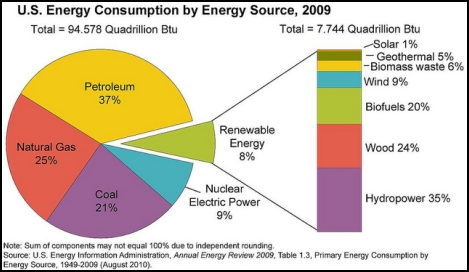 -The source with the highest consumption was
(Multiple Choice)
4.9/5 (35)
Since outliers cause complications in statistical analyses, they should be discarded before computing summaries such as the mean and the standard deviation.
(True/False)
4.9/5 (33)
Which one of the following statistics would be affected by an outlier?
(Multiple Choice)
4.9/5 (29)
Filters
- Essay(0)
- Multiple Choice(0)
- Short Answer(0)
- True False(0)
- Matching(0)