Exam 2: Turning Data Into Information
Exam 1: Statistics Success Stories and Cautionary Tales79 Questions
Exam 2: Turning Data Into Information94 Questions
Exam 3: Relationships Between Quantitative Variables99 Questions
Exam 4: Relationships Between Categorical Variables100 Questions
Exam 5: Sampling: Surveys and How to Ask Questions109 Questions
Exam 6: Gathering Useful Data for Examining Relationships90 Questions
Exam 7: Probability112 Questions
Exam 8: Random Variables115 Questions
Exam 9: Understanding Sampling Distributions: Statistics As Random Variables231 Questions
Exam 10: Estimating Proportions With Confidence104 Questions
Exam 11: Estimating Means With Confidence103 Questions
Exam 12: Testing Hypotheses About Proportions139 Questions
Exam 13: Testing Hypotheses About Means166 Questions
Exam 14: Inference About Simple Regression115 Questions
Exam 15: More About Inference for Categorical Variables111 Questions
Exam 16: Analysis of Variance111 Questions
Exam 17: Turning Information Into Wisdom70 Questions
Select questions type
Listed below is the number of Congressional Medals of Honor awarded in wars fought by the United States.
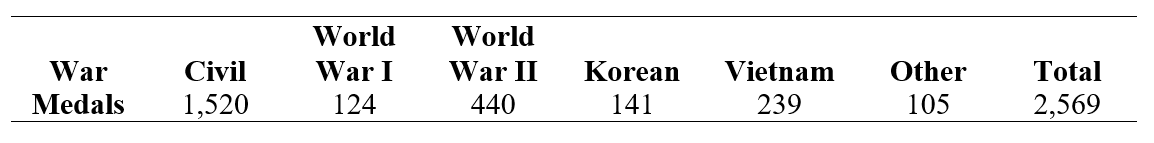 What percent of all medals given were awarded during World War I and World War II?
(Multiple Choice)
4.8/5  (34)
(34)
Use the following information for questions:
The following histogram gives the distribution of the difference between the actual and ideal weights for a sample of male college students. Ideal weights are responses to the question "What is your ideal weight"? The difference = actual -ideal. 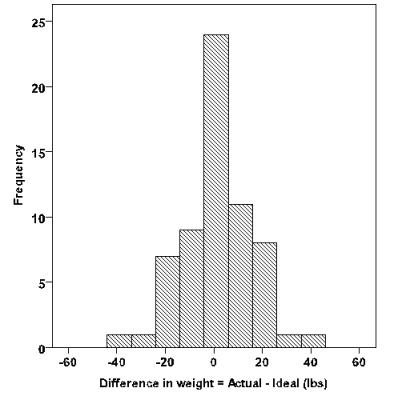 -Most of the men in this sample felt that their actual weight was
(Multiple Choice)
4.8/5 (35)
Use the following information for questions:
The following histogram shows the distribution of the difference between the actual and "ideal" weights for 119 female college students. Ideal weights are responses to the question "What is your ideal weight"? The difference = actual -ideal. (Source: idealwtwomen dataset on the CD.) 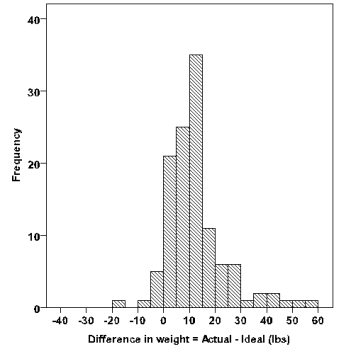 -What is the approximate shape of the distribution?
(Multiple Choice)
4.8/5 (40)
Use the following information for questions:
The following histogram shows the distribution of the difference between the actual and "ideal" weights for 119 female college students. Ideal weights are responses to the question "What is your ideal weight"? The difference = actual -ideal. (Source: idealwtwomen dataset on the CD.)
-The median of the distribution is approximately
(Multiple Choice)
4.8/5 (30)
Use the following information for questions:
The pie chart below shows the U.S. Energy Consumption by Energy Source for the year 2009. 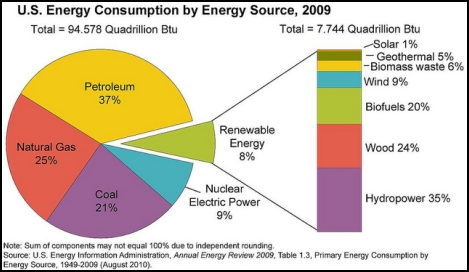 -The combined percent of petroleum and natural gas was
(Multiple Choice)
4.9/5 (37)
For a large sample of blood pressure values, the mean is 120 and the standard deviation is 10. Assuming a bell-shaped curve, which interval is likely to be about the interval that contains 95% of the blood pressures in the sample?
(Multiple Choice)
4.9/5 (34)
What is a reasonable action if an outlier was a mistake made in measuring the object?
(Short Answer)
4.7/5 (37)
Which of the following provides the most information about the shape of a data set?
(Multiple Choice)
4.8/5 (31)
Use the following information for questions:
The following histogram is for the weights (lbs) of 63 male college students.(Source: idealwtmen dataset on the CD.) 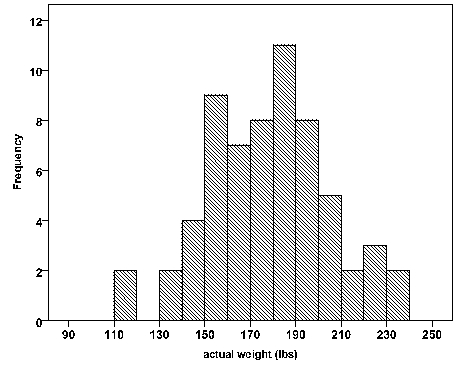 -What is the best description for the approximate shape of this distribution?
(Multiple Choice)
5.0/5 (33)
Which choice lists two statistics that give information only about the location of a dataset and not the spread?
(Multiple Choice)
4.9/5 (44)
Use the following information for questions:
The following histogram shows the distribution of the difference between the actual and "ideal" weights for 119 female college students. Ideal weights are responses to the question "What is your ideal weight"? The difference = actual -ideal. (Source: idealwtwomen dataset on the CD.)
-Most of the women in this sample felt that their actual weight was
(Multiple Choice)
4.8/5 (31)
Which statistic is not resistant to an outlier in the data?
(Multiple Choice)
4.8/5 (32)
What is a reasonable action if an outlier is the value for the only young subject in a sample where all of the other values were for older subjects?
(Short Answer)
4.9/5 (31)
Use the following information for questions:
A five-number summary given in Case Study 1.1 for the fastest ever driving speeds reported by 102 women was: 30, 80, 89, 95, 130.
-What is the interquartile range of these data?
(Multiple Choice)
4.8/5 (31)
Filters
- Essay(0)
- Multiple Choice(0)
- Short Answer(0)
- True False(0)
- Matching(0)