Exam 2: Turning Data Into Information
Exam 1: Statistics Success Stories and Cautionary Tales79 Questions
Exam 2: Turning Data Into Information94 Questions
Exam 3: Relationships Between Quantitative Variables99 Questions
Exam 4: Relationships Between Categorical Variables100 Questions
Exam 5: Sampling: Surveys and How to Ask Questions109 Questions
Exam 6: Gathering Useful Data for Examining Relationships90 Questions
Exam 7: Probability112 Questions
Exam 8: Random Variables115 Questions
Exam 9: Understanding Sampling Distributions: Statistics As Random Variables231 Questions
Exam 10: Estimating Proportions With Confidence104 Questions
Exam 11: Estimating Means With Confidence103 Questions
Exam 12: Testing Hypotheses About Proportions139 Questions
Exam 13: Testing Hypotheses About Means166 Questions
Exam 14: Inference About Simple Regression115 Questions
Exam 15: More About Inference for Categorical Variables111 Questions
Exam 16: Analysis of Variance111 Questions
Exam 17: Turning Information Into Wisdom70 Questions
Select questions type
Use the following information for questions:
A psychologist has developed a new technique intended to improve rote memory. To test the method against other standard methods, 45 high school students are selected at random and each is taught the new technique. The data on the number of words memorized correctly by the students were used to create the following histogram. Note the first class represents the interval [70, 72). 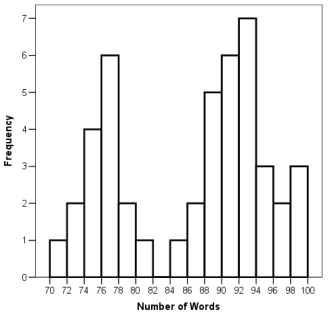 -What proportion of students memorized correctly at least 94 words?
(Short Answer)
4.8/5  (34)
(34)
Use the following information for questions:
A USA TODAY/CNN/Gallup Poll conducted April 19, 2005, was based on telephone interviews with 616 U.S. Catholics. One question asked was "When you think about your commitment to the Catholic Church, how much is your commitment affected by who the pope is -- a great deal, a moderate amount, not much, or not at all? The percentages are provided in the table below.  -The response variable being measured for this question could be called the Commitment Status. State what type of variable commitment status is and suggest an appropriate graph that could be made to display the distribution of this variable.
(Short Answer)
4.7/5 (35)
Use the following information for questions:
The average rainfall during the month of November in San Francisco, California, is 2.62 inches. The standard deviation is 2.79 inches.
-What is the standardized score (z-score) for 1 inch of rain in November?
(Short Answer)
4.9/5 (34)
Which one of the following statements is most correct about a skewed dataset?
(Multiple Choice)
4.9/5 (31)
Which of the following would indicate that a dataset is skewed to the right?
(Multiple Choice)
4.8/5 (40)
The EPA sends out a survey to learn about people's water usage habits. Some of the questions included in the survey are given below.
Q1. How many times a week do you take a shower?
Q2. Do you leave the water running when you brush your teeth?
Q3. When you water your lawn, how long do you let the water run?
For each question, determine if it leads to categorical responses or quantitative responses.
(Short Answer)
4.9/5 (47)
Use the following information for questions:
A five-number summary given in Case Study 1.1 for the fastest ever driving speeds reported by 102 women was: 30, 80, 89, 95, 130.
-Fill in the blank in the following sentence: Approximately 25% of the women reported a fastest ever driving speed of at least _____ mph.
(Multiple Choice)
4.7/5 (41)
Use the following information for questions:
In a survey, students are asked how many hours they study in a typical week. A five-number summary of the responses is: 2, 9, 14, 20, 60.
-Fill in the blank in the following sentence. About 75% of the students spent at least ____ hours studying in a typical week.
(Multiple Choice)
5.0/5 (35)
A recent study was conducted to compare the age of vehicles in a student parking lot versus those in a faculty parking lot at a major university. A random sample of 15 cars was taken from each lot and the age of the car was recorded by taking the current year and subtracting the model year from it. The two boxplots are shown below to summarize these results.
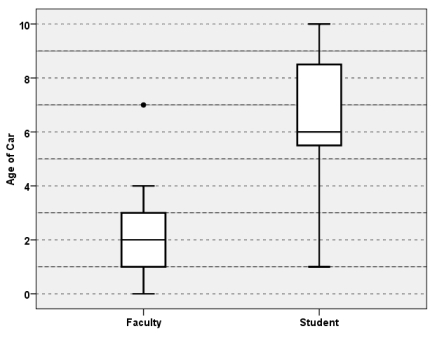 Compare the two distributions based on these side-by-side boxplots.
(Essay)
4.8/5 (36)
Which of the following best describes the standardized (z) score for an observation?
(Multiple Choice)
4.9/5 (39)
Use the following information for questions:
Suppose that amount spent by students on textbooks this semester has approximately a bell-shaped distribution. The mean amount spent was $300 and the standard deviation is $100.
-Which choice best completes the following sentence? About 68% of students spent between ____.
(Multiple Choice)
4.8/5 (31)
Which of the following would indicate that a dataset is not bell-shaped?
(Multiple Choice)
4.7/5 (33)
Use the following information for questions:
The following histogram is for the weights (lbs) of 119 female college students.(Source: idealwtwomen dataset on the CD.) 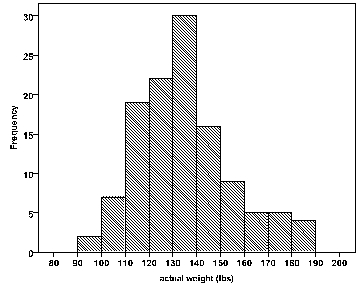 -The best choice for the median weight for the 119 women based on the histogram is approximately
(Multiple Choice)
4.9/5 (28)
Use the following information for questions:
The pie chart below shows the U.S. Energy Consumption by Energy Source for the year 2009. 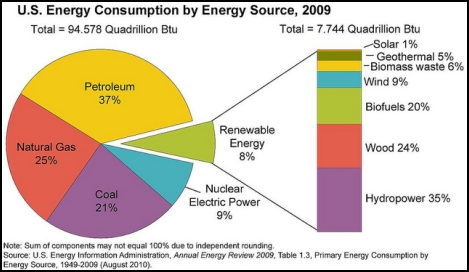 -The consumption of natural gas in the United States totaled approximately how many quadrillion Btu?
(Multiple Choice)
4.8/5 (42)
Use the following information for questions:
The table below provides a statistical summary of the number of CDs owned as reported by students in a class survey done at Penn State University.
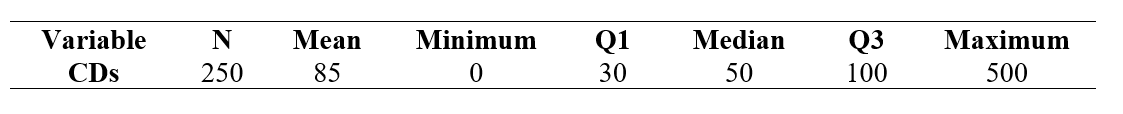 -Approximately what percent of students own somewhere between 30 and 50 CDs?
(Multiple Choice)
4.8/5 (27)
Use the following information for questions:
The pie chart below shows the U.S. Energy Consumption by Energy Source for the year 2009.
-The consumption of renewable sources in the United States totaled approximately 7.7 quadrillion Btu or about 8% of all energy used nationally. Over one-third of the consumption of renewable sources was from
(Multiple Choice)
4.8/5 (41)
Explain the difference between the population standard deviation and the sample standard deviation s.
(Essay)
4.7/5 (32)
Among 300 fatal car accidents, 135 were single-car crashes, 66 were two-car crashes, and 99 involved three or more cars. Calculate the relative frequency and percent of fatal car accidents by the number of cars involved.
(Short Answer)
4.8/5 (26)
A five-number summary for a data set is 35, 50, 60, 70, 90. About what percent of the observations are between 35 and 90?
(Multiple Choice)
4.8/5 (15)
Filters
- Essay(0)
- Multiple Choice(0)
- Short Answer(0)
- True False(0)
- Matching(0)