Exam 6: Inference for Means and Proportions
Exam 1: Collecting Data68 Questions
Exam 2: Describing Data125 Questions
Exam 3: Confidence Intervals148 Questions
Exam 4: Hypothesis Tests119 Questions
Exam 5: Approximating With a Distribution74 Questions
Exam 6: Inference for Means and Proportions166 Questions
Exam 7: Chi-Square Tests for Categorical Variables47 Questions
Exam 8: Anova to Compare Means52 Questions
Exam 9: Inference for Regression123 Questions
Exam 10: Multiple Regression72 Questions
Exam 11: Probability Basics165 Questions
Select questions type
Use the following
In an August 2012 Gallup survey of 1,012 randomly selected U.S. adults (age 18 and over), 53% said that they were dissatisfied with the quality of education students receive in kindergarten through grade 12.
-Provide an interpretation of your interval in the context of this data situation.
(Essay)
5.0/5  (44)
(44)
Use the following
Consider taking random samples of size 30 from Population A with proportion 0.84 and random samples of size 60 from Population B with proportion 0.9.
-Find the mean of the distribution of differences in sample proportions, . 
(Multiple Choice)
4.9/5 (38)
Use the following
Consider taking random samples of size 100 from Population A with mean 85 and standard deviation of 15 and random samples of size 60 from Population B with mean 78 and standard deviation 12.
-How many degrees of freedom should be used when conducting inference for with samples of this size? 
(Multiple Choice)
4.7/5 (43)
Use the following
Consider taking random samples of size 50 from Population A with proportion 0.45 and random samples of size 40 from Population B with proportion 0.38.
-Are the sample sizes for both groups large enough for the Central Limit Theorem to apply so that the differences in sample proportions follow a normal distribution?
(True/False)
4.9/5 (34)
Use the following
In 2005, the average score on the Mathematics portion of the ACT for males was 21.3 with standard deviation 5.3. The average score on the Mathematics portion of the ACT for females was 20.2 with standard deviation 4.8.
-If random samples are taken with 60 males and 60 females, find the mean and standard error of the distribution of differences in sample means,  , where
  and
and  represents the sample means for males and females, respectively. Report the standard error with four decimal places.
(Essay)
4.7/5 (39)
Use the following
Suppose that the makers of M&M's claim that 24% of their Milk Chocolate M&M's are blue.
-Assume that Fun-Size bags of Milk Chocolate M&M's hold 20 candies. Find the mean and standard error of the distribution of sample proportions of blue candies for Fun-Size bags (i.e., samples of size 20). Use four decimal places when reporting the standard error.
(Essay)
4.7/5 (41)
Use the following
Consider a test of  versus
  using the sample results
  = 82.3, s1 = 7.54 with n1 = 28 and
  = 78.6, s2 = 8.16 with n2 = 24.
-What value is closest to the p-value for this test?
= 78.6, s2 = 8.16 with n2 = 24.
-What value is closest to the p-value for this test?
(Multiple Choice)
4.9/5 (40)
Use the following
On November 15 - 18, 2012 Gallup conducted a survey of 1,015 randomly selected U.S. adults about "Black Friday"
shopping. They asked the following question:
"As you know, the Friday after Thanksgiving is one of the biggest shopping days of the year.
Looking ahead, do you personally plan on shopping on the Friday after Thanksgiving, or not?"
Of the 515 men who responded, 16% said "Yes."
Of the 500 women who responded, 20% said "Yes."
-Test, at the 5% level, if this sample provides evidence that the proportion of women planning to shop on Black Friday differs significantly from the proportion of men planning to shop. Include all of the details of the test.
(Essay)
4.9/5 (32)
Use the following
Students in a small statistics class were asked to count the number of scars both on their "dominant"
hand (the one they use most often) and on their "off"
hand. The summary statistics are provided. It is of interest to compare the average number of scars on the dominant and off hands.
 -Test to see if the mean number of scars on dominant hands is significantly different from the mean number of scars on off hands. Use a 10% significance level. Include all of the details of the test.
(Essay)
4.9/5 (37)
Use the following
Consider constructing a 90% confidence interval for  using the sample results
  = 103, s1 = 26.4 with n1 = 50 and
  = 96, s2 = 21.1 with n2 = 40.
-What are the degrees of freedom in this situation?
= 96, s2 = 21.1 with n2 = 40.
-What are the degrees of freedom in this situation?
(Multiple Choice)
4.8/5 (25)
Use the following
Consider taking random samples of size 50 from Population A with mean 15 and standard deviation 3 and random samples of size 75 from Population B with mean 10 and standard deviation 5.
-Find the standard error of the distribution of differences in sample means, . 
(Multiple Choice)
4.9/5 (34)
Use the following
Zumba, often described as a Latin-inspired dance fitness party, is currently one of the most popular group fitness classes, but its health benefits have been little studied. An exercise science professor at a large university conducted a study to investigate some of the health benefits of Zumba. He recorded the weight of 9 female college students before they began a six week long Zumba program. As part of the program, they took a 60 minute long Zumba class three days a week. At the end of the program, the subjects were weighed again. Of interest is their weight loss, defined as weight before the program started minus weight after completing the program. The results are displayed in the following table.
 The mean weight loss for the sample was 2.667 pounds with standard deviation 2.5 pounds. A dotplot of the differences is provided.
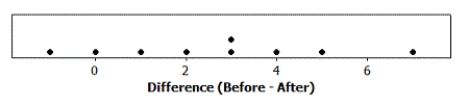 -Construct a 99% confidence interval for the mean weight loss. Use three decimal places in your margin of error.
(Essay)
4.8/5 (35)
Use the following
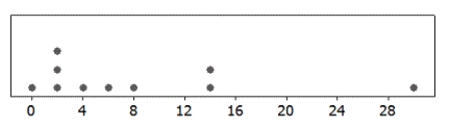
A dotplot and the summary statistics for a sample are provided. In each case, indicate whether or not it is appropriate to use the t-distribution.
-n = 10;  = 7.80; s = 9.28
(Multiple Choice)
4.8/5 (32)
Use the following
Consider taking samples of size 100 from a population with proportion 0.33.
-Find the mean of the distribution of sample proportions.
(Multiple Choice)
4.9/5 (35)
Use the following
Consider constructing a 90% confidence interval for using the sample results = 103, s1 = 26.4 with n1 = 50 and = 96, s2 = 21.1 with n2 = 40.
-What is the best estimate of  ?
?
(Multiple Choice)
4.8/5 (37)
Use the following
February 12, 2009 marked the 200th anniversary of Charles Darwin's birth. To celebrate, Gallup, a national polling organization, surveyed 1,018 randomly selected American adults about their education level and their beliefs about the theory of evolution. In their sample, 325 of their respondents had some college education and 228 were college graduates. Among the 325 respondents with some college education, 133 said that they believed in the theory of evolution. Among the 228 respondents who were college graduates, 121 said that they believed in the theory of evolution.
-Verify that the sample size is large enough in each group to use the normal distribution to construct a confidence interval for a difference in proportions.
(Essay)
4.9/5 (42)
Use the following
The owner of a small pet supply store wants to open a second store in another city, but he only wants to do so if more than one-third of the city's households have pets (otherwise there won't be enough business). He selects a random sample of 150 households and finds that 64 have pets.
-Verify that the sample size is large enough to perform a test to compare the population proportion of households in the city with pets to the target.
(Essay)
4.9/5 (39)
Use the following
Consider taking random samples of size 30 from Population A with proportion 0.84 and random samples of size 60 from Population B with proportion 0.9.
-Find the standard error of the distribution of differences in sample proportions, . 
(Multiple Choice)
4.7/5 (27)
Use the following
Consider constructing a 90% confidence interval for using the sample results = 103, s1 = 26.4 with n1 = 50 and = 96, s2 = 21.1 with n2 = 40.
-What is the margin of error for this confidence interval?
(Multiple Choice)
4.8/5 (39)
Use the following
As part of a course project, a statistics student surveyed random samples of 50 student athletes and 50 student non-athletes at his university, with the goal of comparing the heights of the two groups. His summary statistics are displayed in the provided table.
 -Test, at the 5% level, if student athletes at this university are significantly taller, on average, than student non-athletes. Include all of the details.
(Essay)
4.7/5 (33)
Filters
- Essay(0)
- Multiple Choice(0)
- Short Answer(0)
- True False(0)
- Matching(0)