Exam 6: Inference for Means and Proportions
Exam 1: Collecting Data68 Questions
Exam 2: Describing Data125 Questions
Exam 3: Confidence Intervals148 Questions
Exam 4: Hypothesis Tests119 Questions
Exam 5: Approximating With a Distribution74 Questions
Exam 6: Inference for Means and Proportions166 Questions
Exam 7: Chi-Square Tests for Categorical Variables47 Questions
Exam 8: Anova to Compare Means52 Questions
Exam 9: Inference for Regression123 Questions
Exam 10: Multiple Regression72 Questions
Exam 11: Probability Basics165 Questions
Select questions type
Use the following
According to the National Science Foundation, individuals who graduated in 2010 with a doctoral degree had an average of $14,115 graduate debt. Assume that the standard deviation of graduate debt is $26,400. If we take lots of samples of individuals who graduated in 2010 with a doctoral degree, what would you expect the mean and standard error of the distribution of sample mean graduate debt amounts to be in each case? In each case, use two decimal places when reporting your standard error.
-n = 200 individuals
(Essay)
4.8/5  (39)
(39)
Use the following
A study published in 2008 in the American Journal of Health Promotion (Volume 22, Issue 6) by researchers at the University of Minnesota (U of M) found that 124 out of 1,923 U of M females had over $6,000 in credit card debt while 61 out of 1,236 males had over $6,000 in credit card debt.
-Verify that the sample size is large enough in each group to use the normal distribution to construct a confidence interval for a difference in two proportions.
(Essay)
4.8/5 (41)
Use the following
In May 2012 President Obama made history by revealing his support of gay marriage. Around that time the Gallup Organization polled 1,024 U.S. adults about their opinions on gay/lesbian relations and gay marriage. They found that 54% of those sampled viewed gay/lesbian relations as "morally acceptable".
-What sample size would we need to reduce the margin of error to  1.5%?
1.5%?
(Essay)
4.9/5 (33)
Use the following
Situations comparing two proportions are described. In each case, determine whether the situation involves comparing proportions for two groups or comparing two proportions from the same group.
-Compare the proportion of female students at a university who play a sport to the proportion of male students at a university who play a sport.
(Multiple Choice)
4.9/5 (40)
Report the test statistic (with two decimal places), p-value, and conclusion for a test of  versus
  using the paired data provided in the following table. Use a 5% significance level.
 Assume that the results come from random samples from populations that are approximately normal and that the differences are computed using
(Essay)
4.8/5 (35)
Use the following
In 2012 the Centers for Disease Control and Prevention reported that in a sample of 4,349 African Americans 31% were Vitamin D deficient. Overall, it is believed that Vitamin D deficiency affects 8% of all U.S. adults.
-Verify that the sample size is large enough to use the normal distribution to construct a confidence interval for the proportion of African Americans with Vitamin D deficiency.
(Essay)
4.8/5 (28)
Use the following
A 2009 study to investigate the dominant paws in cats was described in Animal Behaviour (Volume 78, Issue 2). The researchers used a random sample of 42 domestic cats. In this study, each cat was shown a treat (5 grams of tuna), and while the cat watched, the food was placed inside a jar. The opening of the jar was small enough that the cat could not stick its head inside to remove the treat. The researcher recorded the paw that was first used by the cat to try to retrieve the treat. This was repeated 100 times for each cat (over a span of several days). The paw used most often was deemed the dominant paw (note that one cat used both paws equally and was classified as "ambidextrous"). Of the 42 cats studied, 20 were classified as "left-pawed".
-Another researcher wants to conduct a similar study to more precisely estimate the proportion of cats that are "left-pawed". They want to construct a 95% confidence interval that has a margin of error of 6%. How many cats does she need to use in her sample?
(Essay)
4.9/5 (40)
Use the following
A 2009 study to investigate the dominant paws in cats was described in Animal Behaviour (Volume 78, Issue 2). The researchers used a random sample of 42 domestic cats. In this study, each cat was shown a treat (5 grams of tuna), and while the cat watched, the food was placed inside a jar. The opening of the jar was small enough that the cat could not stick its head inside to remove the treat. The researcher recorded the paw that was first used by the cat to try to retrieve the treat. This was repeated 100 times for each cat (over a span of several days). The paw used most often was deemed the dominant paw (note that one cat used both paws equally and was classified as "ambidextrous"). Of the 42 cats studied, 20 were classified as "left-pawed".
-Verify that the sample is large enough to use the normal formula to find a confidence interval for the proportion of domestic cats that are "left-pawed".
(Essay)
4.7/5 (41)
Use the following
A sample of 148 college students at a large university reports getting an average of 6.85 hours of sleep last night with a standard deviation of 2.12 hours.
-Suppose you want to conduct a similar study at your university. Assuming that the standard deviation of this sample is a reasonable estimate of the standard deviation of sleep time at your university, how many students do you need to survey to estimate the mean sleep time of students at your university with 95% confidence and a margin of error of 0.5 hours?
(Essay)
5.0/5 (45)
Use the following
A 1997 study described in the European Journal of Clinical Nutrition compares the growth of vegetarian and omnivorous children, ages 7 - 11, in Northwest England. In the study, each of the 50 vegetarian children in the study was matched with an omnivorous child of the same age with similar demographic characteristics. One of the aspects on which the children were compared was their body mass index (BMI). The differences in BMI for each pair of children (one vegetarian and one omnivore) was computed as vegetarian BMI minus omnivore BMI.
 -Which data analysis method is more appropriate in this situation: paired data difference in means or difference in means with two separate groups? Explain briefly.
(Essay)
4.8/5 (38)
Use the following
For each of the following, assume that the sample is a random sample from a distribution that is reasonably normally distributed and that we are doing inference for a population mean.
-Find endpoints of a t-distribution with 2.5% beyond them in each tail if the sample has size n = 15.
(Short Answer)
4.8/5 (24)
Use the following
Consider taking samples of size 100 from a population with proportion 0.33.
-Is the sample size large enough for the Central Limit Theorem to apply so that the sample proportions follow a normal distribution?
(True/False)
4.9/5 (43)
Use the following
In 2005, the average score on the Mathematics portion of the ACT for males was 21.3 with standard deviation 5.3. The average score on the Mathematics portion of the ACT for females was 20.2 with standard deviation 4.8.
-What affect does increasing the sample sizes have on the center of the distribution?
(Multiple Choice)
4.8/5 (34)
Use the following
A certain species of tree has an average life span of 130 years. A researcher has noticed a large number of trees of this species washing up along a beach as driftwood. She takes core samples from 27 of those trees, selected at random, to count the number of rings and measure the widths of the rings. Counting the rings allows the researcher to determine the age of each tree. The mean age of the sampled driftwood is 119 years old, with standard deviation 46.92 years. The sample data are plotted in the provided dotplot. One of her interests is determining if this sample provides evidence that the average age of the driftwood is less than the 130 year life span expected for this type of tree. If the average age is less than 130 years it might suggest that the trees have died from unusual causes, such as invasive beetles or logging.
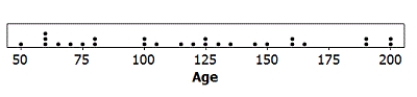 -Test, at the 5% level, if there is evidence that the average age of driftwood along this beach is significantly below 130 years. Include all of the details of the test.
(Essay)
4.8/5 (35)
Use the following
"Black Friday,"
which occurs annually the day after Thanksgiving, is one of the biggest shopping days of the year. During the 2012 holiday season, many stores created controversy by starting their mega-sales on Thanksgiving itself. In a random sample of 25 individuals who shopped during the Black Friday four-day weekend (Thursday - Sunday), the average amount spent was $399.40 with standard deviation $171.10. The data are displayed in the provided dotplot.
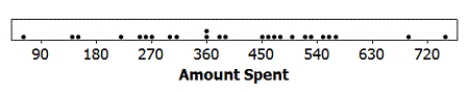 -A natural question would be if more money was spent over the 2012 Black Friday weekend than over the 2011 Black Friday weekend (which did not start on Thursday). What information would be necessary to address this question using the paired data difference in means method? How could the data be collected so that the difference in means for two separate groups method would be most appropriate?
(Essay)
4.8/5 (30)
Use the following
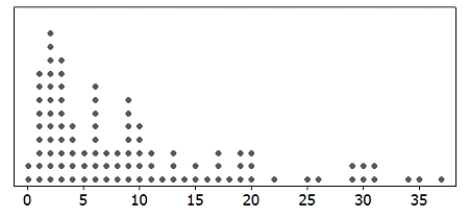
A dotplot and the summary statistics for a sample are provided. In each case, indicate whether or not it is appropriate to use the t-distribution.
-n = 100;  = 9.93; s = 9.247
(Multiple Choice)
4.8/5 (43)
Use the following
In an August 2012 Gallup survey of 1,012 randomly selected U.S. adults (age 18 and over), 53% said that they were dissatisfied with the quality of education students receive in kindergarten through grade 12.
-Construct a 90% confidence interval for the proportion of U.S. adults who are dissatisfied with the quality of education students receive in kindergarten through grade 12. Use three decimal places in your margin of error.
(Essay)
4.8/5 (26)
Use the following
For each of the following, assume that the sample is a random sample from a distribution that is reasonably normally distributed and that we are doing inference for a population mean.
-Find the area in a t-distribution to the left of -0.68 if the sample has size n = 20.
(Short Answer)
4.9/5 (35)
Use the following
November 6, 2012 was election day. Many of the major television networks aired coverage of the incoming election results during the primetime hours. The provided boxplot displays the amount of time (in minutes) spent watching election coverage for a random sample of 25 U.S. adults. In this sample, the average time spent watching election coverage was 80.44 minutes with standard deviation of 43.99 minutes.
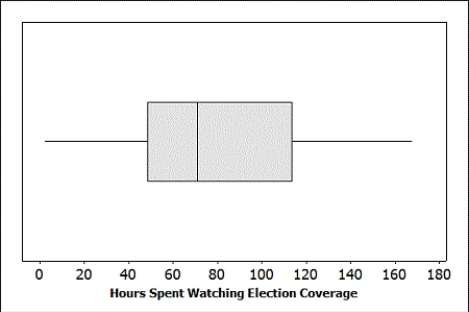 -Provide an interpretation of your interval in the context of this data situation.
(Essay)
4.8/5 (43)
Use the following
In a survey conducted by the Gallup organization September 6-9, 2012, 1,017 adults were asked "In general, how much trust and confidence do you have in the mass media - such as newspapers, TV, and radio - when it comes to reporting the news fully, accurately, and fairly?"
Of the 1,017 respondents, 214 said they had "no confidence at all."
-Test, at the 5% level, if this sample provides evidence that the proportion of U.S. adults who have no confidence in the media differs significantly from 25%. Verify that the sample size is large enough to use the normal distribution to compute the p-value for this test and include all of the details of the test.
(Essay)
4.8/5 (46)
Filters
- Essay(0)
- Multiple Choice(0)
- Short Answer(0)
- True False(0)
- Matching(0)