Exam 6: Inference for Means and Proportions
Exam 1: Collecting Data68 Questions
Exam 2: Describing Data125 Questions
Exam 3: Confidence Intervals148 Questions
Exam 4: Hypothesis Tests119 Questions
Exam 5: Approximating With a Distribution74 Questions
Exam 6: Inference for Means and Proportions166 Questions
Exam 7: Chi-Square Tests for Categorical Variables47 Questions
Exam 8: Anova to Compare Means52 Questions
Exam 9: Inference for Regression123 Questions
Exam 10: Multiple Regression72 Questions
Exam 11: Probability Basics165 Questions
Select questions type
Use the following
On August 8, 2012, the national average price for a gallon of regular unleaded gasoline was $3.63. The prices for a random sample of n = 10 gas stations in the state of Illinois were recorded at that time. The mean price for the sampled gas stations was $3.975, with standard deviation $0.2266. A boxplot of the data is provided.
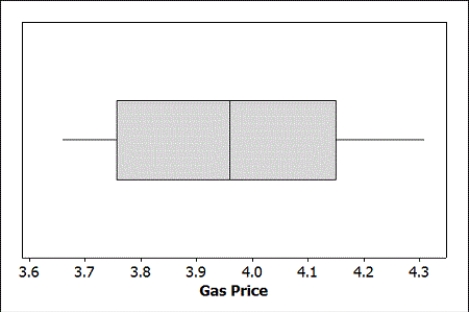 -Construct a 95% confidence interval for the mean gas price in Illinois (on August 8, 2012). Round your margin of error to three decimal places.
(Essay)
4.9/5  (42)
(42)
Use the following
Turkey is a staple at most traditional Thanksgiving dinners. A random sample of 12 grocery store customers were asked about the size of the turkey they were purchasing for Thanksgiving. The average weight was 13.9 pounds with a standard deviation of 2.2 pounds. The boxplot displays the distribution of the sample turkey weights.
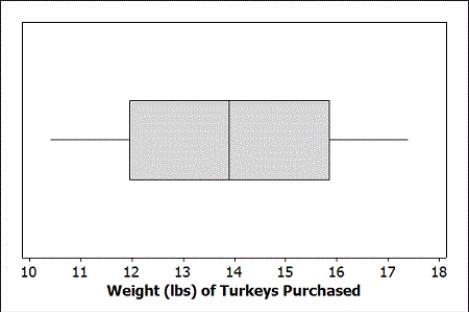 -What sample size would we need to reduce the margin of error to
  1 pound?
(Essay)
4.8/5 (39)
Use the following
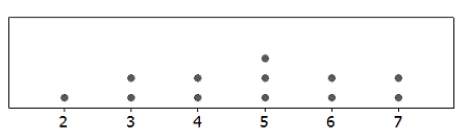
A dotplot and the summary statistics for a sample are provided. In each case, indicate whether or not it is appropriate to use the t-distribution.
-n = 12;  = 4.75; s = 1.603
(Multiple Choice)
4.7/5 (29)
Use the following
In 2005, the average score on the Mathematics portion of the ACT for males was 21.3 with standard deviation 5.3. The average score on the Mathematics portion of the ACT for females was 20.2 with standard deviation 4.8.
-What affect does increasing the sample sizes have on the spread of the distribution?
(Multiple Choice)
4.8/5 (37)
Use the following
"Black Friday,"
which occurs annually the day after Thanksgiving, is one of the biggest shopping days of the year. During the 2012 holiday season, many stores created controversy by starting their mega-sales on Thanksgiving itself. In a random sample of 25 individuals who shopped during the Black Friday four-day weekend (Thursday - Sunday), the average amount spent was $399.40 with standard deviation $171.10. The data are displayed in the provided dotplot.
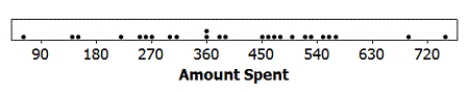 -Provide an interpretation of your interval in the context of this data situation.
(Essay)
4.9/5 (35)
Use the following
Students in a small statistics class were asked to count the number of scars both on their "dominant"
hand (the one they use most often) and on their "off"
hand. The summary statistics are provided. It is of interest to compare the average number of scars on the dominant and off hands.
 -Why is it appropriate to use paired data in this analysis? Explain briefly.
(Essay)
4.8/5 (46)
Use the following
Admissions records at a small university indicates that 6.7% of the students enrolled are international students.
-Find the mean and standard error of the sample proportion of international students in random samples of size 200. Use four decimal places when reporting the standard error.
(Essay)
4.7/5 (35)
Use the following
February 12, 2009 marked the 200th anniversary of Charles Darwin's birth. To celebrate, Gallup, a national polling organization, surveyed 1,018 randomly selected American adults about their education level and their beliefs about the theory of evolution. In their sample, 325 of their respondents had some college education and 228 were college graduates. Among the 325 respondents with some college education, 133 said that they believed in the theory of evolution. Among the 228 respondents who were college graduates, 121 said that they believed in the theory of evolution.
-Construct a 90% confidence interval for the difference between the proportions of college graduates and individuals with some college who believe in the theory of evolution. Round your sample proportions and margin of error to three decimal places.
(Essay)
4.9/5 (39)
Use the following
Students in a large lecture class want to know who has, on average, more Facebook friends, male or female students. The data for the students are displayed in the provided dotplots and summary statistics are available in the provided table.

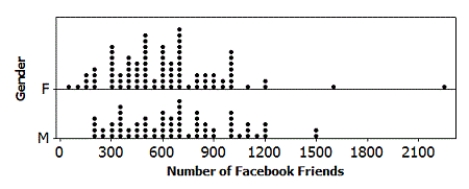 -Is it reasonable to use a t-distribution for inference about the difference in mean number of Facebook friends for male and female students at this university?
(Essay)
4.9/5 (43)
Use the following
A random sample of 48 students at a large university reported getting an average of 7 hours of sleep on weeknights, with standard deviation 1.62 hours. A dotplot of the data is provided.
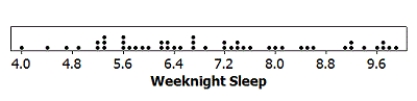 -Explain why it is reasonable to use a t-distribution to perform inference about the mean amount of weeknight sleep for students at this university.
(Essay)
4.9/5 (39)
Use the following
In 2012 the Centers for Disease Control and Prevention reported that in a sample of 4,349 African Americans 31% were Vitamin D deficient. Overall, it is believed that Vitamin D deficiency affects 8% of all U.S. adults.
-Construct a 99% confidence interval for the proportion of African Americans with Vitamin D deficiency. Use three decimal places in your margin of error.
(Essay)
4.7/5 (37)
Use the following
Suppose that the makers of M&M's claim that 24% of their Milk Chocolate M&M's are blue.
-Assume that bags of Milk Chocolate M&M's labeled as "Medium"
size contain 415 candies. Find the mean and standard error of the distribution of sample proportions of blue candies for Medium bags (i.e., samples of size 415). Use four decimal places when reporting the standard error.
(Essay)
4.9/5 (39)
Use the following
A 2009 study to investigate the dominant paws in cats was described in Animal Behaviour (Volume 78, Issue 2). The researchers used a random sample of 42 domestic cats. In this study, each cat was shown a treat (5 grams of tuna), and while the cat watched, the food was placed inside a jar. The opening of the jar was small enough that the cat could not stick its head inside to remove the treat. The researcher recorded the paw that was first used by the cat to try to retrieve the treat. This was repeated 100 times for each cat (over a span of several days). The paw used most often was deemed the dominant paw (note that one cat used both paws equally and was classified as "ambidextrous"). Of the 42 cats studied, 20 were classified as "left-pawed".
-Provide an interpretation of your interval in the context of this data situation.
(Essay)
4.9/5 (34)
Use the following
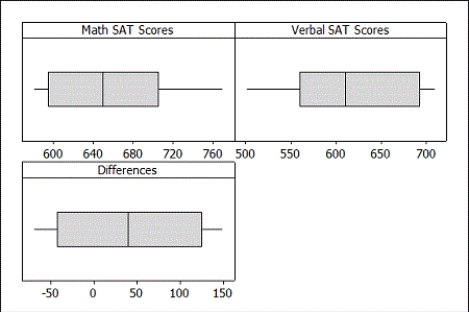
The Math and Verbal SAT scores for a random sample of 10 students from a large introductory statistics course are provided.
 -Boxplots of the raw data are provided. Would it be appropriate to use a t-distribution to construct a confidence interval for, or perform a test about, the difference in the mean Math and Verbal SAT scores? Specifically mention which boxplot(s) you are using to justify your answer.
(Essay)
4.9/5 (40)
Use the following
According to the National Science Foundation, individuals who graduated in 2010 with a doctoral degree had an average of $14,115 graduate debt. Assume that the standard deviation of graduate debt is $26,400. If we take lots of samples of individuals who graduated in 2010 with a doctoral degree, what would you expect the mean and standard error of the distribution of sample mean graduate debt amounts to be in each case? In each case, use two decimal places when reporting your standard error.
-n = 500 individuals
(Essay)
4.8/5 (29)
Use the following
For each of the following, assume that the sample is a random sample from a distribution that is reasonably normally distributed and that we are doing inference for a population mean.
-Find endpoints of a t-distribution with 10% beyond them in each tail if the sample has size n = 5.
(Short Answer)
5.0/5 (32)
Use the following
An Internet provider contacts a random sample of 300 customers and asks how many hours per week the customers use the Internet. The responses are summarized in the provided dotplot. The average amount of time spent on the Internet per week was 7.2 hours, with a standard deviation of 7.9 hours.
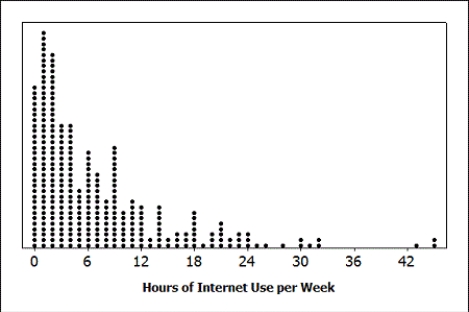 -Is it reasonable to use the t-distribution to construct a confidence interval for the average amount of time customers of this Internet provider spend on the Internet each week? Explain briefly.
(Essay)
4.8/5 (38)
Use the following
A sample of 148 college students at a large university reports getting an average of 6.85 hours of sleep last night with a standard deviation of 2.12 hours.
-Construct a 98% confidence interval for the average amount of sleep students at this university got last night. Use two decimal places in your margin of error.
(Essay)
4.8/5 (32)
Use the following
For each of the following, assume that the sample is a random sample from a distribution that is reasonably normally distributed and that we are doing inference for a population mean.
-Find the area in a t-distribution to the left of -2.7 if the sample has size n = 35.
(Short Answer)
4.8/5 (43)
Use the following
A professor with a large introductory statistics class noticed that nearly half of his students missed class the day before a long break (like Thanksgiving Break or Spring Break). He randomly called on students and found 10 students in attendance and 10 students who had skipped class. Later in his office, he examined the current course grades for the 20 students he had selected. A plot of his findings and summary statistics are provided. Note that the grades were entered as proportions, and thus a grade of 0.925 is a 92.5% in the course.

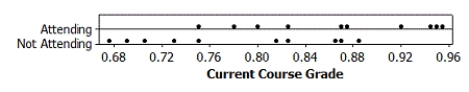 -Test, at the 5% level, if there is evidence that students who attended class before break have, on average, a significantly higher course grade than those who skipped. Include all of the details of the test.
(Essay)
4.9/5 (37)
Filters
- Essay(0)
- Multiple Choice(0)
- Short Answer(0)
- True False(0)
- Matching(0)