Exam 6: Inference for Means and Proportions
Exam 1: Collecting Data68 Questions
Exam 2: Describing Data125 Questions
Exam 3: Confidence Intervals148 Questions
Exam 4: Hypothesis Tests119 Questions
Exam 5: Approximating With a Distribution74 Questions
Exam 6: Inference for Means and Proportions166 Questions
Exam 7: Chi-Square Tests for Categorical Variables47 Questions
Exam 8: Anova to Compare Means52 Questions
Exam 9: Inference for Regression123 Questions
Exam 10: Multiple Regression72 Questions
Exam 11: Probability Basics165 Questions
Select questions type
Use the following
Consider a test of  versus
  using the sample results
  = 82.3, s1 = 7.54 with n1 = 28 and
  = 78.6, s2 = 8.16 with n2 = 24.
-What is the test statistic for this test?
= 78.6, s2 = 8.16 with n2 = 24.
-What is the test statistic for this test?
(Multiple Choice)
4.7/5  (42)
(42)
Construct a 96% confidence interval for  using the paired data in the following table. Round all values to three decimal places.
 Assume that the results come from random samples from populations that are approximately normal and that the differences are computed using
(Essay)
4.9/5 (35)
Use the following
In a survey conducted by the Gallup organization September 6-9, 2012, 1,017 adults were asked "In general, how much trust and confidence do you have in the mass media - such as newspapers, TV, and radio - when it comes to reporting the news fully, accurately, and fairly?"
Of the 1,017 respondents, 214 said they had "no confidence at all."
-Construct a 90% confidence interval for the proportion of U.S. adults who have no confidence in the media. Round the margin of error to three decimal places.
(Essay)
4.8/5 (42)
Use the following
Students in a large lecture class want to know who has, on average, more Facebook friends, male or female students. The data for the students are displayed in the provided dotplots and summary statistics are available in the provided table.

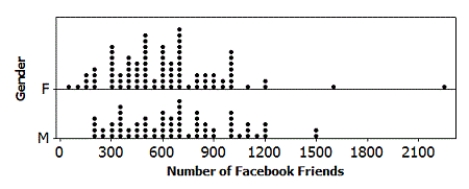 -Construct a 95% confidence interval for the difference in mean number of Facebook friends for male and female students at this university. Use two decimal places in your margin of error.
(Essay)
4.7/5 (42)
Use the following
Suppose that the makers of M&M's claim that 24% of their Milk Chocolate M&M's are blue.
-Would you expect using bags of Milk Chocolate M&M's labeled as "Large" size, which contain more candies than the "Medium"
Size bags, to result in a larger or smaller standard error?
(Multiple Choice)
4.8/5 (42)
Use the following
In May 2012 President Obama made history by revealing his support of gay marriage. Around that time the Gallup Organization polled 1,024 U.S. adults about their opinions on gay/lesbian relations and gay marriage. They found that 54% of those sampled viewed gay/lesbian relations as "morally acceptable".
-Does this sample provide evidence that the majority of U.S. adults (i.e., more than half) believe that gay/lesbian relations are "morally acceptable"? Use a 5% significance level. Verify that the sample size is large enough to use the normal distribution to compute the p-value for this test and include all of the details of the test.
(Essay)
4.8/5 (40)
Use the following
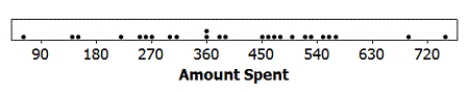
"Black Friday,"
which occurs annually the day after Thanksgiving, is one of the biggest shopping days of the year. During the 2012 holiday season, many stores created controversy by starting their mega-sales on Thanksgiving itself. In a random sample of 25 individuals who shopped during the Black Friday four-day weekend (Thursday - Sunday), the average amount spent was $399.40 with standard deviation $171.10. The data are displayed in the provided dotplot.
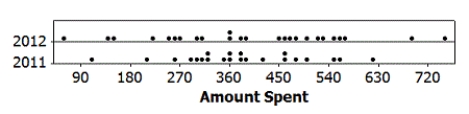
 -Suppose we know that in a random sample of n = 22 individuals who shopped over Black Friday weekend in 2011 the average amount spent was $381.30 with standard deviation $119.80. Construct a 95% confidence interval for the difference in the mean amount spent between the 2012 and 2011 Black Friday weekends. Round the margin of error to two decimal places.
Recall that for the 2012 sample of 25 individuals, the average amount spent was $399.40 with standard deviation $171.10. Dotplots of both samples are provided.
-Suppose we know that in a random sample of n = 22 individuals who shopped over Black Friday weekend in 2011 the average amount spent was $381.30 with standard deviation $119.80. Construct a 95% confidence interval for the difference in the mean amount spent between the 2012 and 2011 Black Friday weekends. Round the margin of error to two decimal places.
Recall that for the 2012 sample of 25 individuals, the average amount spent was $399.40 with standard deviation $171.10. Dotplots of both samples are provided.
(Essay)
4.7/5 (40)
Use the following
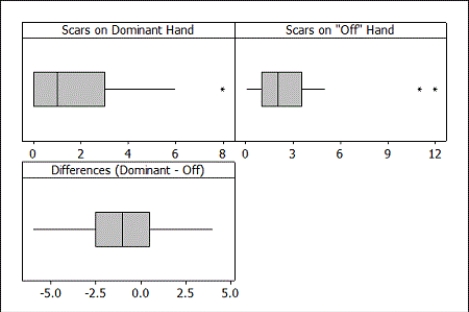
Students in a small statistics class were asked to count the number of scars both on their "dominant"
hand (the one they use most often) and on their "off"
hand. The summary statistics are provided. It is of interest to compare the average number of scars on the dominant and off hands.
 -Boxplots of the raw data are provided. Would it be appropriate to use a t-distribution to construct a confidence interval for, or perform a test about, the difference in the mean number of scars on dominant and off hands? Specifically mention which boxplot(s) you are using to justify your answer.
(Essay)
4.8/5 (36)
Use the following
In an August 2012 Gallup survey of 1,012 randomly selected U.S. adults (age 18 and over), 53% said that they were dissatisfied with the quality of education students receive in kindergarten through grade 12.
-Test, at the 5% level, if this sample provides evidence that the proportion of Americans who are dissatisfied with education in kindergarten through grade 12 differs significantly from 50%. Be sure to verify that it is appropriate to use a normal distribution to compute the p-value and include all of the details of the test.
(Essay)
4.7/5 (41)
Use the following
As part of a course project, a statistics student surveyed random samples of 50 student athletes and 50 student non-athletes at his university, with the goal of comparing the heights of the two groups. His summary statistics are displayed in the provided table.
 -Construct a 99% confidence interval for the difference in mean heights between student athletes and non-athletes at this university. Use two decimal places in your margin of error.
(Essay)
4.8/5 (33)
Use the following
A confidence interval for a population proportion p is 0.640 to 0.675.
-What is the margin of error?
(Multiple Choice)
4.9/5 (38)
Use the following
For each of the following, assume that the sample is a random sample from a distribution that is reasonably normally distributed and that we are doing inference for a population mean.
-Find endpoints of a t-distribution with 1.5% beyond them in each tail if the sample has size 22.
(Short Answer)
4.9/5 (36)
Use the following
A study published in 2008 in the American Journal of Health Promotion (Volume 22, Issue 6) by researchers at the University of Minnesota (U of M) found that 124 out of 1,923 U of M females had over $6,000 in credit card debt while 61 out of 1,236 males had over $6,000 in credit card debt.
-Construct a 95% confidence interval for the difference between the proportions of female and male University of Minnesota students who have more than $6,000 in credit card debt (pf - pm). Round your sample proportions and margin of error to four decimal places.
(Essay)
4.9/5 (51)
Use the following
A study published in 2008 in the American Journal of Health Promotion (Volume 22, Issue 6) by researchers at the University of Minnesota (U of M) found that 124 out of 1,923 U of M females had over $6,000 in credit card debt while 61 out of 1,236 males had over $6,000 in credit card debt.
-Test, at the 5% level, if there is evidence that the proportion of female students at U of M with more that $6,000 credit card debt is greater than the proportion of males at U of M with more than $6,000 credit card debt. Include all details of the test.
(Essay)
4.8/5 (38)
Use the following
Consider taking samples of size 25 from a population with proportion 0.65.
-Find the mean of the distribution of sample proportions.
(Multiple Choice)
4.8/5 (37)
Use the following
A random sample of 48 students at a large university reported getting an average of 7 hours of sleep on weeknights, with standard deviation 1.62 hours. A dotplot of the data is provided.
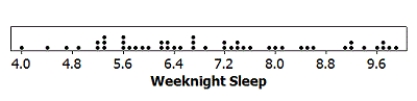 -It is recommended, for most college age students, to get 8 hours of sleep each night. Does this sample provide evidence, at the 5% level, that college students at this university get significantly less sleep, on average, than what is recommended? Include all of the details of the test.
(Essay)
4.8/5 (26)
Use the following
Consider taking samples of size 25 from a population with proportion 0.65.
-Is the sample size large enough for the Central Limit Theorem to apply so that the sample proportions follow a normal distribution?
(True/False)
4.9/5 (36)
Use the following
The Math and Verbal SAT scores for a random sample of 10 students from a large introductory statistics course are provided.
 -Which data analysis method is more appropriate in this situation: paired data difference in means or difference in means with two separate groups? Explain briefly.
(Essay)
4.9/5 (27)
Use the following
A small university is trying to monitor its electricity usage. For a random sample of 30 weekend days (Saturdays and Sundays), the student center used an average of 94.26 kilowatt hours (kWh) with standard deviation 43.29. For a random sample of 60 weekdays, (Monday - Friday), the student center used an average of 112.63 kWh with standard deviation 32.07.
-Test, at the 5% level, if significantly more electricity is used at the student center, on average, on weekdays than weekend days. Include all details of the test.
(Essay)
4.7/5 (42)
Use the following
The owner of a small pet supply store wants to open a second store in another city, but he only wants to do so if more than one-third of the city's households have pets (otherwise there won't be enough business). He selects a random sample of 150 households and finds that 64 have pets.
-Verify that the sample size is large enough to use the normal distribution to construct a confidence interval for the proportion of the city's households that own pets.
(Essay)
4.9/5 (37)
Filters
- Essay(0)
- Multiple Choice(0)
- Short Answer(0)
- True False(0)
- Matching(0)