Exam 6: Inference for Means and Proportions
Exam 1: Collecting Data68 Questions
Exam 2: Describing Data125 Questions
Exam 3: Confidence Intervals148 Questions
Exam 4: Hypothesis Tests119 Questions
Exam 5: Approximating With a Distribution74 Questions
Exam 6: Inference for Means and Proportions166 Questions
Exam 7: Chi-Square Tests for Categorical Variables47 Questions
Exam 8: Anova to Compare Means52 Questions
Exam 9: Inference for Regression123 Questions
Exam 10: Multiple Regression72 Questions
Exam 11: Probability Basics165 Questions
Select questions type
Use the following
Admissions records at a small university indicates that 6.7% of the students enrolled are international students.
-Find the mean and standard error of the sample proportion of international students in random samples of size 100. Use four decimal places when reporting the standard error.
(Essay)
4.8/5  (41)
(41)
Use the following
Turkey is a staple at most traditional Thanksgiving dinners. A random sample of 12 grocery store customers were asked about the size of the turkey they were purchasing for Thanksgiving. The average weight was 13.9 pounds with a standard deviation of 2.2 pounds. The boxplot displays the distribution of the sample turkey weights.
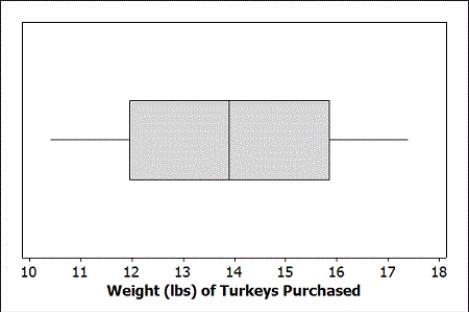 -Provide an interpretation of your interval in the context of this data situation.
(Essay)
4.8/5 (27)
Use the following
In an August 2012 Gallup survey of 1,012 randomly selected U.S. adults (age 18 and over), 53% said that they were dissatisfied with the quality of education students receive in kindergarten through grade 12.
-Suppose you want to estimate the proportion of local adults who are dissatisfied with the education students receive in kindergarten through grade 12 with 95% confidence and a 5% margin of error. If you suspect that local adults won't differ drastically from those Gallup used, how many people should you sample?
(Essay)
5.0/5 (47)
Use the following
Every year since the 1957-58 academic year, the National Science Foundation (NSF) conducts its Survey of Earned Doctorates (SED) of all individuals receiving research doctoral degrees from accredited U.S. institutions. The results from the 2010 survey published on the NSF website indicate that 78.2% of individuals earning their doctorate in the physical sciences have no graduate debt while 48.3% of those earning their doctorate in the social sciences have no graduate debt. Of the 48,069 research doctorates granted in 2010, 93% completed the SED, thus the information collected by the NSF can be good approximations of the population parameters.
-Suppose we take random samples of 25 individuals who earned a doctorate in the physical sciences (in 2010) and 50 individuals who earned a doctorate in the social sciences (in 2010). Find the mean and standard error (using four decimal places) of the distribution of differences in sample proportions (  ), and indicate if the sample sizes are large enough to use the Central Limit Theorem.
(Essay)
4.8/5 (42)
Use the following
The owner of a small pet supply store wants to open a second store in another city, but he only wants to do so if more than one-third of the city's households have pets (otherwise there won't be enough business). He selects a random sample of 150 households and finds that 64 have pets.
-Test, at the 5% level, if this sample provides evidence that significantly more than one-third of the city's households have a pet. Include all of the details of the test.
(Essay)
5.0/5 (30)
Use the following
An Internet provider contacts a random sample of 300 customers and asks how many hours per week the customers use the Internet. The responses are summarized in the provided dotplot. The average amount of time spent on the Internet per week was 7.2 hours, with a standard deviation of 7.9 hours.
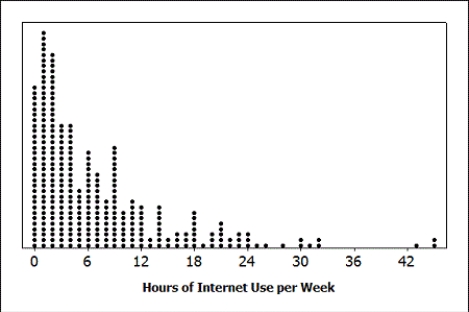 -If we want a margin of error of 0.5 hours, how large of a sample would we need?
(Essay)
4.9/5 (42)
Filters
- Essay(0)
- Multiple Choice(0)
- Short Answer(0)
- True False(0)
- Matching(0)