Exam 6: Inference for Means and Proportions
Exam 1: Collecting Data68 Questions
Exam 2: Describing Data125 Questions
Exam 3: Confidence Intervals148 Questions
Exam 4: Hypothesis Tests119 Questions
Exam 5: Approximating With a Distribution74 Questions
Exam 6: Inference for Means and Proportions166 Questions
Exam 7: Chi-Square Tests for Categorical Variables47 Questions
Exam 8: Anova to Compare Means52 Questions
Exam 9: Inference for Regression123 Questions
Exam 10: Multiple Regression72 Questions
Exam 11: Probability Basics165 Questions
Select questions type
Use the following
On November 15 - 18, 2012 Gallup conducted a survey of 1,015 randomly selected U.S. adults about "Black Friday"
shopping. They asked the following question:
"As you know, the Friday after Thanksgiving is one of the biggest shopping days of the year.
Looking ahead, do you personally plan on shopping on the Friday after Thanksgiving, or not?"
Of the 515 men who responded, 16% said "Yes."
Of the 500 women who responded, 20% said "Yes."
-Construct a 95% confidence interval for the difference between the proportion of men and women who planned to shop on the Friday after Thanksgiving. Use three decimal places when computing the margin of error.
(Essay)
4.9/5  (36)
(36)
Use the following
A small university is trying to monitor its electricity usage. For a random sample of 30 weekend days (Saturdays and Sundays), the student center used an average of 94.26 kilowatt hours (kWh) with standard deviation 43.29. For a random sample of 60 weekdays, (Monday - Friday), the student center used an average of 112.63 kWh with standard deviation 32.07.
-Construct a 95% confidence interval for the difference in mean electricity use at the student center between weekdays and weekend days. Use two decimal places in your margin of error.
(Essay)
4.7/5 (44)
Use the following
An Internet provider contacts a random sample of 300 customers and asks how many hours per week the customers use the Internet. The responses are summarized in the provided dotplot. The average amount of time spent on the Internet per week was 7.2 hours, with a standard deviation of 7.9 hours.
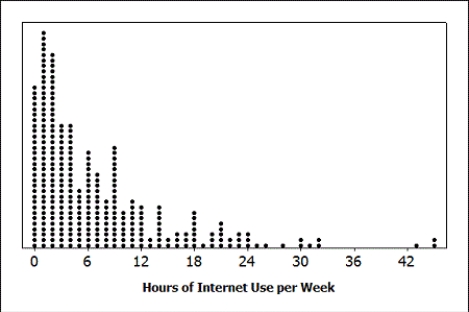 -Construct a 95% confidence interval for the average amount of time customers of this Internet provider spend on the Internet each week. Round the margin of error to one decimal place.
(Essay)
4.8/5 (36)
Use the following
A 2009 study to investigate the dominant paws in cats was described in Animal Behaviour (Volume 78, Issue 2). The researchers used a random sample of 42 domestic cats. In this study, each cat was shown a treat (5 grams of tuna), and while the cat watched, the food was placed inside a jar. The opening of the jar was small enough that the cat could not stick its head inside to remove the treat. The researcher recorded the paw that was first used by the cat to try to retrieve the treat. This was repeated 100 times for each cat (over a span of several days). The paw used most often was deemed the dominant paw (note that one cat used both paws equally and was classified as "ambidextrous"). Of the 42 cats studied, 20 were classified as "left-pawed".
-Construct a 95% confidence interval for the proportion of domestic cats that are "left-pawed". Use three decimal places in your margin of error.
(Essay)
4.8/5 (40)
Use the following
In 2005, the average score on the Mathematics portion of the ACT for males was 21.3 with standard deviation 5.3. The average score on the Mathematics portion of the ACT for females was 20.2 with standard deviation 4.8.
-If random samples are taken with 50 males and 70 females, find the mean and standard error of the distribution of differences in sample means,  , where
  and
and  represents the sample means for males and females, respectively. Report the standard error with four decimal places.
(Essay)
4.8/5 (40)
Use the following
Consider taking random samples of size 30 from Population A with proportion 0.84 and random samples of size 60 from Population B with proportion 0.9.
-Are the sample sizes for both groups large enough for the Central Limit Theorem to apply so that the differences in sample proportions follows a Normal distribution?
(True/False)
4.9/5 (39)
Use the following
The owner of a small pet supply store wants to open a second store in another city, but he only wants to do so if more than one-third of the city's households have pets (otherwise there won't be enough business). He selects a random sample of 150 households and finds that 64 have pets.
-Construct a 95% confidence interval for the proportion of the city's households that own pets. Round the sample proportion and margin of error to three decimal places.
(Essay)
4.7/5 (45)
Use the following to answer questions :
In a 2012 survey, Gallup asked a random sample of U.S. adults if they would prefer to have a job outside the home, or if they would prefer to stay home to care for the family and home. Of the 504 males they surveyed, 391 said that they would prefer to have a job outside of the home. Of the 473 females they surveyed, 254 said that they would prefer a job outside of the home.
-Test, at the 1% level, if there is evidence that the proportion of men who would prefer a job outside of the home is significantly higher than the proportion of women who would prefer a job outside of the home.
(Essay)
4.7/5 (42)
Use the following
Turkey is a staple at most traditional Thanksgiving dinners. A random sample of 12 grocery store customers were asked about the size of the turkey they were purchasing for Thanksgiving. The average weight was 13.9 pounds with a standard deviation of 2.2 pounds. The boxplot displays the distribution of the sample turkey weights.
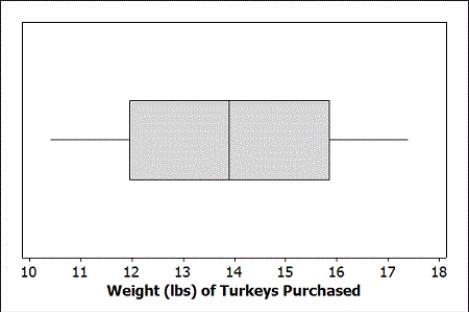 -According to the Minnesota Turkey Growers Association's website, the average weight of turkeys purchased for Thanksgiving dinner is 15 pounds. Test, at the 5% level, if this sample provides evidence that the average weight of turkeys purchased at this store differs from 15 pounds. Include all of the details of the test.
(Essay)
4.8/5 (39)
Use the following
Consider a test of  versus
  using the sample results
  = 82.3, s1 = 7.54 with n1 = 28 and
  = 78.6, s2 = 8.16 with n2 = 24.
-What are the degrees of freedom for this test?
= 78.6, s2 = 8.16 with n2 = 24.
-What are the degrees of freedom for this test?
(Multiple Choice)
4.8/5 (32)
Use the following
For each of the following, find the mean and standard error of the distribution of sample means. Use two decimal places when reporting your standard error.
-Samples of size 25 from a population with mean 10 and standard deviation 2.
(Essay)
4.9/5 (32)
Use the following
On August 8, 2012, the national average price for a gallon of regular unleaded gasoline was $3.63. The prices for a random sample of n = 10 gas stations in the state of Illinois were recorded at that time. The mean price for the sampled gas stations was $3.975, with standard deviation $0.2266. A boxplot of the data is provided.
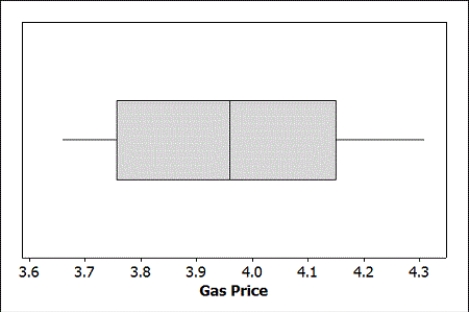 -Is it reasonable to use the t-distribution to perform a test about the average gas price in Illinois (on August 8, 2012)?
(Essay)
4.9/5 (30)
Use the following
In a survey conducted by the Gallup organization September 6-9, 2012, 1,017 adults were asked "In general, how much trust and confidence do you have in the mass media - such as newspapers, TV, and radio - when it comes to reporting the news fully, accurately, and fairly?"
Of the 1,017 respondents, 214 said they had "no confidence at all."
-Verify that the sample size is large enough to use the normal distribution to construct a confidence interval for the proportion of U.S. adults who have no confidence in the media.
(Essay)
4.8/5 (44)
Use the following
For each of the following, find the mean and standard error of the distribution of sample means. Use two decimal places when reporting your standard error.
-Samples of size 250 from a population with mean 80 and standard deviation of 15.
(Essay)
4.8/5 (33)
Use the following
In an October 2012 survey of 7,786 randomly selected adults living in Germany, 5,840 said they exercised for at least 30 minutes three or more times per week.
-Suppose an exercise scientist wants to estimate the proportion of American adults who exercise for 30 minutes three or more times per week. He wants to construct a 90% confidence interval with a margin of error of 1%. Note that Americans are typically thought to not be as active as individuals in other countries, and thus the estimate from Germany is likely not a good estimate for Americans. What sample size does he need?
(Essay)
4.8/5 (38)
Use the following
A sample of 148 college students at a large university reports getting an average of 6.85 hours of sleep last night with a standard deviation of 2.12 hours.
-Verify that it is reasonable to use the t-distribution to construct a confidence interval for the average amount of sleep students at this university got last night.
(Essay)
4.9/5 (28)
Use the following
"Black Friday,"
which occurs annually the day after Thanksgiving, is one of the biggest shopping days of the year. During the 2012 holiday season, many stores created controversy by starting their mega-sales on Thanksgiving itself. In a random sample of 25 individuals who shopped during the Black Friday four-day weekend (Thursday - Sunday), the average amount spent was $399.40 with standard deviation $171.10. The data are displayed in the provided dotplot.
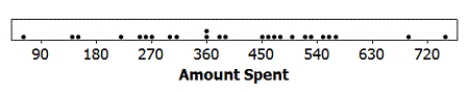 -Suppose we know that in a random sample of n = 22 individuals who shopped over Black Friday weekend in 2011 the average amount spent was $381.30 with standard deviation $119.80. Recall that for the 2012 sample of 25 individuals, the average amount spent was $399.40 with standard deviation $171.10. Dotplots of both samples are provided.
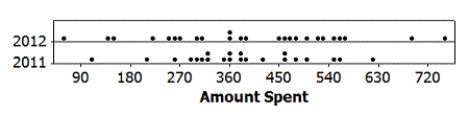 Test, at the 5% level, if the samples provide evidence that Black Friday shoppers spent more, on average, in 2012 than they did in 2011. Include all of the details of the test.
(Essay)
4.9/5 (32)
Use the following
The Math and Verbal SAT scores for a random sample of 10 students from a large introductory statistics course are provided.
 -Construct a 90% confidence interval for the difference in mean Math and Verbal SAT scores for students in the class. Use two decimal places in your margin of error.
(Essay)
4.8/5 (34)
Use the following
In May 2012 President Obama made history by revealing his support of gay marriage. Around that time the Gallup Organization polled 1,024 U.S. adults about their opinions on gay/lesbian relations and gay marriage. They found that 54% of those sampled viewed gay/lesbian relations as "morally acceptable".
-Verify that the sample size is large enough to use the normal distribution to construct a confidence interval for the proportion of U.S. adults who consider gay and lesbian relations to be "morally acceptable".
(Essay)
4.9/5 (32)
Use the following
Consider taking samples of size 100 from a population with proportion 0.33.
-Find the standard error of the distribution of sample proportions.
(Multiple Choice)
4.9/5 (32)
Filters
- Essay(0)
- Multiple Choice(0)
- Short Answer(0)
- True False(0)
- Matching(0)