Exam 7: Statistical Process Control
Exam 1: Operations and Productivity126 Questions
Exam 2: Operations Strategy in a Global Environment135 Questions
Exam 3: Project Management123 Questions
Exam 4: Forecasting144 Questions
Exam 5: Design of Goods and Services137 Questions
Exam 6: Managing Quality130 Questions
Exam 7: Statistical Process Control154 Questions
Exam 8: Process Strategy131 Questions
Exam9: Capacity and Constraint Management107 Questions
Exam 10: Location Strategies140 Questions
Exam 11: Layout Strategies161 Questions
Exam 12: Human Resources, Job Design, and Work Measurement191 Questions
Exam 13: Supply-Chain Management145 Questions
Exam 14: Outsourcing as a Supply-Chain Strategy73 Questions
Exam 15: Inventory Management155 Questions
Exam 16: Aggregate Planning134 Questions
Exam 17: Material Requirements Planning MRP and ERP169 Questions
Exam 18: Short-Term Scheduling139 Questions
Exam 19: Just-In-Time and Lean Options137 Questions
Exam 20: Maintenance and Reliability130 Questions
Exam 21: Decision-Making Tools97 Questions
Exam 22: Linear Programming100 Questions
Exam 23: Transportation Models94 Questions
Exam 24: Waiting-Line Models135 Questions
Exam 25: Learning Curves111 Questions
Exam 26: Simulation93 Questions
Select questions type
According to the text, the most common choice of limits for control charts is usually
Free
(Multiple Choice)
4.7/5  (33)
(33)
Correct Answer: Verified
C
The __________ is a quality control chart used to control the number of defects per unit of output.
Free
(Short Answer)
4.8/5 (37)
Correct Answer:Verified
c-chart
A bank's manager has videotaped 20 different teller transactions to observe the number of mistakes being made. Ten transactions had no mistakes, five had one mistake and five had two mistakes. Compute proper control limits at the 90% confidence level.
Free
(Essay)
4.8/5 (38)
Correct Answer:Verified
A c-chart should be used, and from Table S6.2, the z-value = 1.65.
The mean c-bar = [10(0) + 5(1) + 5(2)]/20 = 0.75.
UCLc = 0.75 + 1.65 = 2.18
LCLc = 0.75 - 1.65 = -0.68 (or 0)
The purpose of process control is to detect when natural causes of variation are present.
(True/False)
4.8/5 (35)
At your first job out of college you have been assigned to the production of bottled 20 oz. soda.
The process has upper and lower limits of 20.5 and 19.5 oz, respectively, with a mean of 19.8 oz
and standard deviation of .3 oz. Your manager has requested the process produce no more than 3.4
defects per 1 million bottles produced. Calculate Cpk and then determine if the process is capable
or if you should be looking for assignable variation.
(Essay)
4.7/5 (36)
A quality analyst wants to construct a sample mean chart for controlling a packaging process. He knows from past experience that when the process is operating as intended, packaging weight is normally distributed with a mean of twenty ounces, and a process standard deviation of two ounces. Each day last week, he randomly selected four packages and weighed each. The data from that activity appears below.
Weight Day Package 1 Package 2 Package 3 Package 4 Monday 23 22 23 24 Tuesday 23 21 19 21 Wednesday 20 19 20 21 Thursday 18 19 20 19 Friday 18 20 22 20
(a) If he sets an upper control limit of 21 and a lower control limit of 19 around the target value of twenty ounces, what is the probability of concluding that this process is out of control when it is actually in control?
(b) With the UCL and LCL of part a, what do you conclude about this process-is it in control?
(Essay)
4.9/5 (33)
A car mechanic is thinking of guaranteeing customers that an oil change will take no more than 15 minutes with a 99.73% confidence level. He takes a few samples of size 5 and finds the process mean to be 13 minutes with a standard deviation of .2 minutes and average sample range of 1.2 minutes. Find the A₂, D₄, and D₃ values and use them to compute the upper and lower limits for an x-bar chart. Use the upper limit to determine if the mechanic can offer a 15 minute guarantee. Assume the mechanic plots the samples on the x-bar control chart and finds the process is in control, is there anything else the mechanic is missing to ensure the process is in control?
(Essay)
4.7/5 (33)
The type of inspection that classifies items as being either good or defective is
(Multiple Choice)
4.8/5 (38)
Cartons of Plaster of Paris are supposed to weigh exactly 32 oz. Inspectors want to develop process control charts. They take ten samples of six boxes each and weigh them. Based on the following data, compute the lower and upper control limits and determine whether the process is in control.
Sample Mean Range 1 33.8 1.1 2 34.6 0.3 3 34.7 0.4 4 34.1 0.7 5 34.2 0.3 6 34.3 0.4 7 33.9 0.5 8 34.1 0.8 9 34.2 0.4 10 34.4 0.3
(Essay)
4.7/5 (31)
Which of the following statements on acceptance sampling is true?
(Multiple Choice)
4.8/5 (34)
A city police chief decides to do an annual review of the police department by checking the number of monthly complaints. If the total number of complaints in each of the 12 months were 15, 18, 13, 12, 16, 20, 5, 10, 9, 11, 8, and 3 and the police chief wants a 90% confidence level, are the complaints in control?
(Essay)
4.8/5 (45)
An acceptance sampling plan must define "good lots" and "bad lots" and specify the risk level associated with each one.
(True/False)
4.8/5 (31)
A p-chart is appropriate to plot the number of typographic errors per page of text.
(True/False)
4.9/5 (30)
Which of the following statements about acceptance sampling is true?
(Multiple Choice)
4.8/5 (26)
A lot that is accepted by acceptance sampling is certified to be free of defects.
(True/False)
4.7/5 (33)
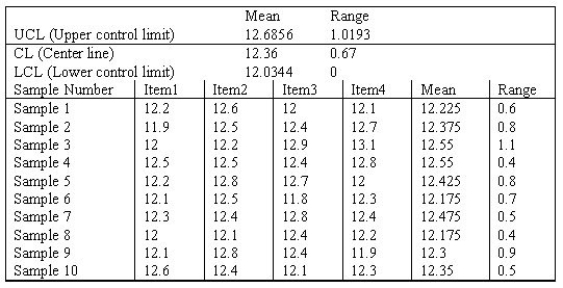
Examine the Statistical Process Control outputs below. Answer the following questions.
a. What is the sample size?
b. What is the number of samples?
c. What is the mean of sample 8; what is the range of sample 10?
d.. Is this process in control?
Explain--a simple Yes or No is insufficient.
e. What additional steps should the quality assurance team take?
(Essay)
4.8/5 (34)
A small, independent amusement park collects data on the number of cars with out-of-state license plates. The sample size is fixed at n=25 each day. Data from the previous 10 days indicate the following number of out-of-state license plates:
Day Out-of-state Plates 1 6 2 4 3 5 4 7 5 8 6 3 7 4 8 5 9 3 10 11
(a) Calculate the overall proportion of "tourists" (cars with out-of-state plates) and the standard deviation of proportions.
(b) Using ± 3σ limits, calculate the LCL and UCL for these data.
(c) Is the process under control?
Explain.
(Essay)
4.9/5 (42)
A(n) __________ is a graph that describes how well an acceptance plan discriminates between good and bad lots.
(Short Answer)
4.9/5 (39)
Filters
- Essay(0)
- Multiple Choice(0)
- Short Answer(0)
- True False(0)
- Matching(0)