Exam 7: Statistical Process Control
Exam 1: Operations and Productivity126 Questions
Exam 2: Operations Strategy in a Global Environment135 Questions
Exam 3: Project Management123 Questions
Exam 4: Forecasting144 Questions
Exam 5: Design of Goods and Services137 Questions
Exam 6: Managing Quality130 Questions
Exam 7: Statistical Process Control154 Questions
Exam 8: Process Strategy131 Questions
Exam9: Capacity and Constraint Management107 Questions
Exam 10: Location Strategies140 Questions
Exam 11: Layout Strategies161 Questions
Exam 12: Human Resources, Job Design, and Work Measurement191 Questions
Exam 13: Supply-Chain Management145 Questions
Exam 14: Outsourcing as a Supply-Chain Strategy73 Questions
Exam 15: Inventory Management155 Questions
Exam 16: Aggregate Planning134 Questions
Exam 17: Material Requirements Planning MRP and ERP169 Questions
Exam 18: Short-Term Scheduling139 Questions
Exam 19: Just-In-Time and Lean Options137 Questions
Exam 20: Maintenance and Reliability130 Questions
Exam 21: Decision-Making Tools97 Questions
Exam 22: Linear Programming100 Questions
Exam 23: Transportation Models94 Questions
Exam 24: Waiting-Line Models135 Questions
Exam 25: Learning Curves111 Questions
Exam 26: Simulation93 Questions
Select questions type
In most acceptance sampling plans, when a lot is rejected, the entire lot is inspected and all defective items are replaced. When using this technique the AOQ
(Multiple Choice)
4.9/5  (37)
(37)
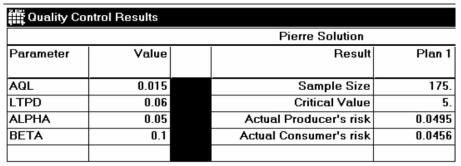
Pierre's Motorized Pirogues and Mudboats is setting up an acceptance sampling plan for the special air cleaners he manufactures for his boats. His specifications, and the resulting plan, are shown on the POM for Windows output below. In relatively plain English (someone else will translate for Pierre), explain exactly what he will do when performing the acceptance sampling procedure, and what actions he might take based on the results.
(Essay)
4.8/5 (45)
Mistakes stemming from workers' inadequate training represent an assignable cause of variation.
(True/False)
4.7/5 (38)
Larry's boat shop wants to monitor the number of blemishes in the paint of each boat. Construct a 3-sigma c-chart to determine if their paint process is in control using the following data.
Sample Number Number of Defects 1 3 2 4 3 2 4 1 5 3 6 2 7 1 8 4 9 2 10 3
(Essay)
4.8/5 (32)
In the table below are selected values for the OC curve for the acceptance sampling plan n=210, c=6. Upon failed inspection, defective items are replaced. Calculate the AOQ for each data point. (You may assume that the population is much larger than the sample.) Plot the AOQ curve. At approximately what population defective rate is the AOQ at its worst?
Explain how this happens. How well does this plan meet the specifications of AQL=0.015, α=0.05; LTPD=0.05, β=0.10?
Discuss.
0.00 1.00000 0.01 0.99408 0.02 0.86650 0.03 0.55623 0.04 0.26516 0.05 0.10056 0.06 0.03217 0.07 0.00905 0.08 0.00231 0.09 0.00054 0.10 0.00012
(Essay)
4.8/5 (36)
To set -chart upper and lower control limits, one must know the process central line, which is the
(Multiple Choice)
4.7/5 (39)
Which of the following is true regarding the average outgoing quality level?
(Multiple Choice)
4.9/5 (39)
McDaniel Shipyards wants to develop control charts to assess the quality of its steel plate. They take ten sheets of 1" steel plate and compute the number of cosmetic flaws on each roll. Each sheet is 20' by 100'. Based on the following data, develop limits for the control chart, plot the control chart, and determine whether the process is in control.
Sheet Number of flaws 1 1 2 1 3 2 4 0 5 1 6 5 7 0 8 2 9 0 10 2
(Essay)
4.8/5 (44)
The Central Limit Theorem states that when the sample size increases, the distribution of the sample means will approach the normal distribution.
(True/False)
4.8/5 (46)
A manager wants to build 3-sigma control limits for a process. The target value for the mean of the process is 10 units, and the standard deviation of the process is 6. If samples of size 9 are to be taken, the UCL and LCL will be
(Multiple Choice)
4.9/5 (37)
The __________ are calculated to show how much allowance should be made for natural variation.
(Short Answer)
4.8/5 (39)
A process that is in statistical control will always yield products that meet their design specifications.
(True/False)
4.9/5 (37)
The local newspaper receives several complaints per day about typographic errors. Over a seven-day period, the publisher has received calls from readers reporting the following number of errors: 4, 3, 2, 6, 7, 3, and 9. Based on these data alone, what type of control chart(s) should the publisher use?
(Multiple Choice)
5.0/5 (46)
A department chair wants to monitor the percentage of failing students in classes in her department. Each class had an enrollment of 50 students last spring. The number of failing students in the 10 classes offered that term were 1, 4, 2, 0, 0, 0, 0, 0, 0, and 3, respectively. Compute the control limits for a p-chart at the 95% confidence level. Is the process in control?
(Essay)
4.9/5 (34)
The x-bar chart, like the c-chart, is based on the exponential distribution.
(True/False)
4.8/5 (43)
The statistical definition of Six Sigma allows for 3.4 defects per million. This is achieved by a Cpk index of
(Multiple Choice)
4.7/5 (36)
The __________ is the lowest level of quality that we are willing to accept.
(Short Answer)
4.9/5 (31)
Filters
- Essay(0)
- Multiple Choice(0)
- Short Answer(0)
- True False(0)
- Matching(0)