Exam 7: Statistical Process Control
Exam 1: Operations and Productivity126 Questions
Exam 2: Operations Strategy in a Global Environment135 Questions
Exam 3: Project Management123 Questions
Exam 4: Forecasting144 Questions
Exam 5: Design of Goods and Services137 Questions
Exam 6: Managing Quality130 Questions
Exam 7: Statistical Process Control154 Questions
Exam 8: Process Strategy131 Questions
Exam9: Capacity and Constraint Management107 Questions
Exam 10: Location Strategies140 Questions
Exam 11: Layout Strategies161 Questions
Exam 12: Human Resources, Job Design, and Work Measurement191 Questions
Exam 13: Supply-Chain Management145 Questions
Exam 14: Outsourcing as a Supply-Chain Strategy73 Questions
Exam 15: Inventory Management155 Questions
Exam 16: Aggregate Planning134 Questions
Exam 17: Material Requirements Planning MRP and ERP169 Questions
Exam 18: Short-Term Scheduling139 Questions
Exam 19: Just-In-Time and Lean Options137 Questions
Exam 20: Maintenance and Reliability130 Questions
Exam 21: Decision-Making Tools97 Questions
Exam 22: Linear Programming100 Questions
Exam 23: Transportation Models94 Questions
Exam 24: Waiting-Line Models135 Questions
Exam 25: Learning Curves111 Questions
Exam 26: Simulation93 Questions
Select questions type
A retail store manager is trying to improve and control the rate at which cashiers sign customers up
for store credit cards. After posting a p-chart of the store's credit card sign-ups the manager takes
new samples of size 50 three weeks later. He finds that each sample of 50 contained 5 credit card
signups on average. Find p-bar and 99.73% control limits.
(Essay)
4.9/5  (44)
(44)
If = 23 ounces, ? = 0.4 ounces, and n = 16, the ±3? control limits will be
(Multiple Choice)
5.0/5 (35)
Plots of sample ranges indicate that the most recent value is below the lower control limit. What course of action would you recommend?
(Multiple Choice)
4.8/5 (42)
A process range chart illustrates the amount of variation within the samples.
(True/False)
4.8/5 (35)
The number of late insurance claim payouts per 100 should be measured with a
(Multiple Choice)
4.8/5 (45)
The probability of rejecting a good lot is known as consumer's risk.
(True/False)
4.8/5 (34)
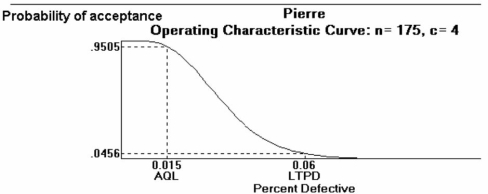
Pierre's Motorized Pirogues and Mudboats is setting up an acceptance sampling plan for the special air cleaners he manufactures for his boats. His specifications, and the resulting plan, are shown on the POM for Windows output below. Pierre is a bit confused. He mistakenly thinks that acceptance sampling will reject all bad lots and accept all good lots. Explain why this will not happen.
(Essay)
4.8/5 (48)
A Cpk index greater than __________ is a capable process, one that generates fewer than 2.7 defects per 1000 at the ±3σ level.
(Short Answer)
4.9/5 (36)
Define consumer's risk. How does it relate to the errors of hypothesis testing?
What is the symbol for its value?
(Essay)
4.9/5 (42)
The steeper an OC curve, the better it discriminates between good and bad lots.
(True/False)
4.8/5 (42)
For an x-bar chart where the standard deviation is known, the Upper Control Limit
(Multiple Choice)
4.7/5 (33)
Mean charts and range charts complement one another, one detecting shifts in process average, the other detecting shifts in process dispersion.
(True/False)
4.7/5 (34)
A nationwide parcel delivery service keeps track of the number of late deliveries (more than 30 minutes past the time promised to clients) per day. They plan on using a control chart to plot their results. Which type of control chart(s) would you recommend?
(Multiple Choice)
4.7/5 (36)
If a process has only natural variations, __________ percent of the time the sample averages will fall inside the (or ) control limits.
(Short Answer)
4.8/5 (36)
Ten samples of a process measuring the number of returns per 100 receipts were taken for a local retail store. The number of returns were 10, 9, 11, 7, 3, 12, 8, 4, 6, 11. Find the standard deviation of the sampling distribution. (Hint- Use p-bar formula)
(Multiple Choice)
4.8/5 (44)
Filters
- Essay(0)
- Multiple Choice(0)
- Short Answer(0)
- True False(0)
- Matching(0)