Exam 3: Forecasting
Exam 1: Introduction to Operations Management74 Questions
Exam 2: Competitiveness70 Questions
Exam 3: Forecasting139 Questions
Exam 4: Product and Service Design78 Questions
Exam 4: RELIABILITY – Static12 Questions
Exam 6: Strategic Capacity Planning for Products and Services85 Questions
Exam 7: Decision Theory– Static114 Questions
Exam 8: Process Selection and Facility Layout132 Questions
Exam 9: Work Design and Measurement129 Questions
Exam 10: learning curve– Static61 Questions
Exam 11: Location Planning and Analysis62 Questions
Exam 12: The Transportation Model– Static20 Questions
Exam 13: Management of Quality97 Questions
Exam 14: Quality Control112 Questions
Exam 15: Acceptance Sampling– Static51 Questions
Exam 16: Aggregate Planning and Master Scheduling74 Questions
Exam 17: MRP and ERP81 Questions
Exam 18: Inventory Management128 Questions
Exam 19: JIT and Lean Operations79 Questions
Exam 20: Maintenance– Static36 Questions
Exam 21: Supply Chain Management87 Questions
Exam 22: Scheduling98 Questions
Exam 23: Project Management113 Questions
Exam 24: Management of Waiting Lines64 Questions
Exam 25: Linear Programming93 Questions
Select questions type
Correlation measures the strength and direction of a relationship between variables.
(True/False)
4.8/5  (43)
(43)
Which of the following helps improve supply chain forecasting performance?
(Multiple Choice)
4.9/5 (38)
A control chart involves setting action limits for cumulative forecast error.
(True/False)
5.0/5 (46)
The naive forecast can serve as a quick and easy standard of comparison against which to judge the cost and accuracy of other techniques.
(True/False)
4.8/5 (39)
Which of the following changes would tend to shorten the time frame for short-term forecasting?
(Multiple Choice)
4.8/5 (37)
Suppose a four-period weighted average is being used to forecast demand. Weights for the periods are as follows: wt-4 = 0.1, wt-3 = 0.2, wt-2 = 0.3 and wt-1 = 0.4. Demand observed in the previous four periods was as follows: At-4 = 380, At-3 = 410, At-2 = 390, At-1 = 400. What will be the demand forecast for period t?
(Multiple Choice)
4.8/5 (26)
For new products in a strong growth mode, a low alpha will minimize forecast errors when using exponential smoothing techniques.
(True/False)
4.7/5 (29)
Professor Very Busy needs to allocate time next week to include time for office hours. He needs to forecast the number of students who will seek appointments. He has gathered the following data: 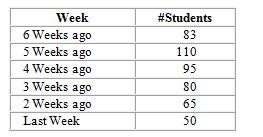 What is this week's forecast using exponential smoothing with alpha = .2, if the forecast for two weeks ago was 90?
(Multiple Choice)
4.8/5 (37)
The president of State University wants to forecast student enrollments for this academic year based on the following historical data: Year Enrollments 5 Years ago 15,000 4 Years ago 16,000 3 Years ago 18,000 2 Years ago 20,000 Last Year 21,000
What is the forecast for this year using a four-year simple moving average?
(Multiple Choice)
4.9/5 (34)
Using the latest observation in a sequence of data to forecast the next period is:
(Multiple Choice)
4.8/5 (37)
The owner of Darkest Tans Unlimited in a local mall is forecasting this month's (October's) demand for the one new tanning booth based on the following historical data: Month Number of Visits April 100 May 140 June 110 July 150 August 120 September 160
What is this month's forecast using the naive approach?
(Multiple Choice)
4.8/5 (35)
The president of State University wants to forecast student enrollments for this academic year based on the following historical data: Year Enrollments 5 Years ago 15,000 4 Years ago 16,000 3 Years ago 18,000 2 Years ago 20,000 Last Year 21,000
What is the forecast for this year using trend-adjusted (double) smoothing with alpha = .05 and beta = .3, if the forecast for last year was 21,000, the forecast for two years ago was 19,000, and the trend estimate for last year's forecast was 1,500?
(Multiple Choice)
4.8/5 (38)
Given forecast errors of 5, 0, -4, and 3, what is the mean absolute deviation?
(Multiple Choice)
4.8/5 (34)
Forecasts based on an average tend to exhibit less variability than the original data.
(True/False)
4.7/5 (31)
Which of the following would tend to decrease forecast accuracy?
(Multiple Choice)
4.7/5 (36)
The more novel a new product or service design is, the more forecasters have to rely on:
(Multiple Choice)
4.9/5 (42)
A manager uses the following equation to predict monthly receipts: Yt = 40,000 + 150t. What is the forecast for July if t = 0 in April of this year?
(Multiple Choice)
4.8/5 (43)
Given an actual demand of 105, a forecasted value of 97, and an alpha of .4, the simple exponential smoothing forecast for the next period would be:
(Multiple Choice)
4.7/5 (44)
The Delphi approach involves the use of a series of questionnaires to achieve a consensus forecast.
(True/False)
4.7/5 (37)
Filters
- Essay(0)
- Multiple Choice(0)
- Short Answer(0)
- True False(0)
- Matching(0)