Exam 19: Appendix A: Behavioral Statistics
Exam 1: A: Introduction to Psychology and Research Methods250 Questions
Exam 1: B: Introduction to Psychology and Research Methods250 Questions
Exam 1: C: Introduction to Psychology and Research Methods163 Questions
Exam 2: A: Brain and Behavior500 Questions
Exam 2: C: Brain and Behavior142 Questions
Exam 3: A: Human Development250 Questions
Exam 3: B: Human Development250 Questions
Exam 3: C: Human Development241 Questions
Exam 3: D: Human Development70 Questions
Exam 4: A: Sensation and Perception250 Questions
Exam 4: B: Sensation and Perception250 Questions
Exam 4: C: Sensation and Perception250 Questions
Exam 4: D: Sensation and Perception70 Questions
Exam 5: A: States of Consciousness250 Questions
Exam 5: B: States of Consciousness250 Questions
Exam 5: C: States of Consciousness211 Questions
Exam 5: D: States of Consciousness70 Questions
Exam 6: A: Conditioning and Learning250 Questions
Exam 6: B: Conditioning and Learning250 Questions
Exam 6: C: Conditioning and Learning192 Questions
Exam 6: D: Conditioning and Learning70 Questions
Exam 7: A: Memory250 Questions
Exam 7: B: Memory250 Questions
Exam 7: C: Memory222 Questions
Exam 8: A: Cognition,language,and Creativity250 Questions
Exam 8: B: Cognition,language,and Creativity250 Questions
Exam 8: C: Cognition,language,and Creativity125 Questions
Exam 9: A: Intelligence250 Questions
Exam 9: B: Intelligence250 Questions
Exam 9: C: Intelligence91 Questions
Exam 10: A: Motivation and Emotion249 Questions
Exam 10: B: Motivation and Emotion250 Questions
Exam 10: C: Motivation and Emotion250 Questions
Exam 10: D: Motivation and Emotion70 Questions
Exam 11: A: Gender and Sexuality250 Questions
Exam 11: B: Gender and Sexuality250 Questions
Exam 11: C: Gender and Sexuality235 Questions
Exam 11: D: Gender and Sexuality Completion40 Questions
Exam 12: A: Personality250 Questions
Exam 12: B: Personality250 Questions
Exam 12: C: Personality250 Questions
Exam 12: D: Personality70 Questions
Exam 13: A: Health,stress,and Coping250 Questions
Exam 13: B: Health,stress,and Coping250 Questions
Exam 13: C: Health,stress,and Coping241 Questions
Exam 14: A: Psychological Disorders250 Questions
Exam 14: B: Psychological Disorders250 Questions
Exam 14: C: Psychological Disorders250 Questions
Exam 14: D: Psychological Disorders70 Questions
Exam 15: A: Therapies250 Questions
Exam 15: B: Therapies250 Questions
Exam 15: C: Therapies250 Questions
Exam 15: D: Therapies70 Questions
Exam 16: A: Social Thinking and Social Influence250 Questions
Exam 16: B: Social Thinking and Social Influence250 Questions
Exam 16: C: Social Thinking and Social Influence190 Questions
Exam 17: A: Prosocial and Antisocial Behavior250 Questions
Exam 17: B: Prosocial and Antisocial Behavior250 Questions
Exam 17: C: Prosocial and Antisocial Behavior108 Questions
Exam 18: A: Applied Psychology249 Questions
Exam 18: B: Applied Psychology250 Questions
Exam 18: C: Applied Psychology159 Questions
Exam 19: Appendix A: Behavioral Statistics207 Questions
Exam 20: Appendix B: Behavioral Statistics254 Questions
Select questions type
Carol is drawing a graph of a frequency distribution in which she places the number of scores falling in each class as points on a line.Carol is graphing a
(Multiple Choice)
4.8/5  (35)
(35)
The variability of a set of scores refers to which aspect of those scores?
(Multiple Choice)
4.8/5 (32)
Dots connected by straight lines are to a frequency polygon as a bar graph is to a
(Multiple Choice)
4.8/5 (35)
Regarding correlations,which of the following statements is FALSE?
(Multiple Choice)
4.7/5 (34)
A researcher studies the effects of a new therapy on a small group of depressed individuals in the hopes of generalizing these findings for use with all depressed people.This researcher is using __________ statistics.
(Multiple Choice)
4.9/5 (43)
If the points on a scatter diagram are clustered in a pattern that extends from upper left to the lower right,this would suggest that the two variables depicted are
(Multiple Choice)
4.8/5 (40)
In order to convert a number to a z-score,it is necessary,within a group of scores,to know the mean and the
(Multiple Choice)
4.7/5 (39)
Melissa is using the three measures of central tendency,which is a type of
(Multiple Choice)
4.9/5 (56)
The scatter diagram below depicts which type of relationship? 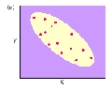
(Multiple Choice)
4.9/5 (34)
Which of the following correlation coefficients indicates the weakest relationship?
(Multiple Choice)
4.9/5 (32)
Which of the following is made by labeling class intervals on the abscissa,frequencies on the ordinate,and then drawing bars for each class interval with the height of each bar being determined by the number of scores in each class?
(Multiple Choice)
4.8/5 (41)
The fewer days that students attend class,the lower their grades.This would be a
(Multiple Choice)
5.0/5 (40)
Matt is using a single score that describes how scattered or "spread out" his distribution of scores is.Matt is using a measure of
(Multiple Choice)
4.8/5 (37)
A bell-shaped distribution,with a large number of scores in the middle,tapering to very few extremely high and low scores is known as a
(Multiple Choice)
4.8/5 (42)
Filters
- Essay(0)
- Multiple Choice(0)
- Short Answer(0)
- True False(0)
- Matching(0)