Exam 1: Getting Started
Exam 1: Getting Started350 Questions
Exam 2: The Usand Global Economies199 Questions
Exam 3: The Economic Problem271 Questions
Exam 4: Demand and Supply317 Questions
Exam 5: Gdp: a Measure of Total Production and Income254 Questions
Exam 6: Jobs and Unemployment343 Questions
Exam 7: The Cpi and the Cost of Living265 Questions
Exam 8: Potential Gdp and the Natural Unemployment Rate207 Questions
Exam 9: Economic Growth267 Questions
Exam 10: Finance, Saving, and Investment269 Questions
Exam 11: The Monetary System361 Questions
Exam 12: Money, Interest, and Inflation261 Questions
Exam 13: Aggregate Supply and Aggregate Demand272 Questions
Exam 14: Aggregate Expenditure Multiplier311 Questions
Exam 15: The Short-Run Policy Tradeoff208 Questions
Exam 16: Fiscal Policy203 Questions
Exam 17: Monetary Policy188 Questions
Exam 18: International Trade Policy218 Questions
Exam 19: International Finance255 Questions
Select questions type
Suppose the relationship between a person's age and his or her height is plotted with the age measured along the x-axis and the height measured along the y-axis.Then, the curve showing this relationship is
(Multiple Choice)
4.9/5  (34)
(34)
What is the reason that all economic issues and problems occur?
(Multiple Choice)
4.8/5 (34)
 -A graph showing the values of an economic variable for different groups in a population at a point in time is called a
(Multiple Choice)
4.8/5 (32)
The opportunity cost of a one-unit increase in an activity
(Multiple Choice)
4.9/5 (35)
A choice made by comparing all relevant alternatives systematically and incrementally is
(Multiple Choice)
4.9/5 (41)
Most economic graphs have two lines perpendicular to each other.Where these lines met is called the
(Multiple Choice)
4.7/5 (27)
A graph has a point that is either a maximum or a minimum.To the left of the point, the slope of relationship is positive.To the right of the point, the slope is negative.Is the point a maximum point or a minimum point?
Be sure to draw a figure that supports your answer.
(Essay)
4.7/5 (36)
A graph of two variables is a vertical line.What is the interpretation of this result?
(Essay)
4.9/5 (23)
 -A time-series graph displays the price of gold.The slope of the line is negative for periods when the
(Multiple Choice)
4.9/5 (32)
Will, Bill, and Phil decide to study an extra hour for an exam.Instead of studying, they could have gone out to eat, played football, or watched TV.Which of the following statements is correct?
(Multiple Choice)
4.9/5 (38)
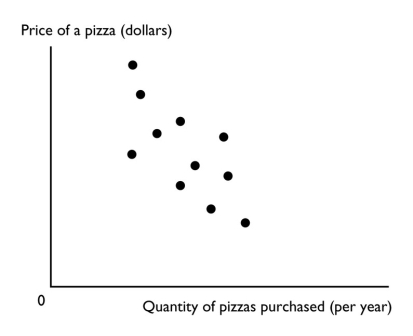
The tendency for the values of two variables to move together in a predictable and related way is
(Multiple Choice)
4.8/5 (34)
Which of the following statements is true regarding scarcity?
(Multiple Choice)
4.9/5 (32)
Shaniq can spend the next hour studying for a finance test, hiking along the Oregon coast, watching reruns of Lost on television, or napping.If she decides to study, what is the opportunity cost of her choice: hiking, watching television, or napping?
(Essay)
4.7/5 (32)
Filters
- Essay(0)
- Multiple Choice(0)
- Short Answer(0)
- True False(0)
- Matching(0)