Exam 1: Getting Started
Exam 1: Getting Started350 Questions
Exam 2: The Usand Global Economies199 Questions
Exam 3: The Economic Problem271 Questions
Exam 4: Demand and Supply317 Questions
Exam 5: Gdp: a Measure of Total Production and Income254 Questions
Exam 6: Jobs and Unemployment343 Questions
Exam 7: The Cpi and the Cost of Living265 Questions
Exam 8: Potential Gdp and the Natural Unemployment Rate207 Questions
Exam 9: Economic Growth267 Questions
Exam 10: Finance, Saving, and Investment269 Questions
Exam 11: The Monetary System361 Questions
Exam 12: Money, Interest, and Inflation261 Questions
Exam 13: Aggregate Supply and Aggregate Demand272 Questions
Exam 14: Aggregate Expenditure Multiplier311 Questions
Exam 15: The Short-Run Policy Tradeoff208 Questions
Exam 16: Fiscal Policy203 Questions
Exam 17: Monetary Policy188 Questions
Exam 18: International Trade Policy218 Questions
Exam 19: International Finance255 Questions
Select questions type
"It is impossible to represent a three variable relationship in a two-dimensional graph." Is this statement true or false?
Explain your answer.
(Essay)
4.8/5  (37)
(37)
If a decision is made and it is the best choice for society, the decision is said to be
(Multiple Choice)
4.9/5 (32)
The characteristic from which all economic problems arise is
(Multiple Choice)
4.9/5 (33)
"The change in the value of the variable measured on the y-axis divided by the change in the value of the variable measured on the x-axis" is the definition of
(Multiple Choice)
4.9/5 (26)
Which of the following is a microeconomic topic?
I. K-Mart's decision to close stores that are not making a profit
Ii. Home Depot's choice to hire more full-time employees because its sales increased
Iii. Delta Airlines changes its fares
(Multiple Choice)
4.8/5 (34)
The question "Should economics majors or sociology majors earn more after they graduate? " is an example of a ________ question.
(Multiple Choice)
4.8/5 (40)
Whenever people's incomes increase, they buy more guitars.Hence a scatter diagram shows that the relationship between income and guitars purchased is
(Multiple Choice)
4.9/5 (43)
Suppose that, instead of taking this test, you could either have worked and earned income or partied and had a pleasurable time.Your opportunity cost of taking the test is the
(Multiple Choice)
4.9/5 (37)
The question "Will doctors or lawyers have higher annual incomes?
" represents which of the three basic economic questions?
(Essay)
4.8/5 (34)
What are the two different types of relationships that variables can have?
Explain each.What do these relationships look like when they are graphed?
(Essay)
4.9/5 (33)
X Y 2 20 4 16 6 12 8 8
-Graph the data in the table above in the figure.Label the axes.
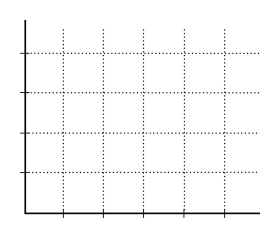 a. Is the relationship between X and Y positive or negative?
b. What is the slope when X = 4?
c. What is the slope when X = 8?
a. Is the relationship between X and Y positive or negative?
b. What is the slope when X = 4?
c. What is the slope when X = 8?
(Essay)
4.9/5 (35)
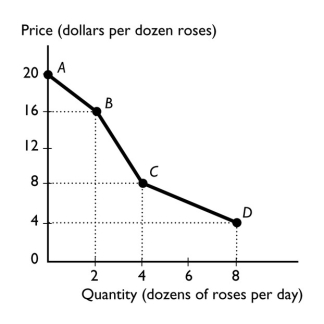 -The figure above shows the relationship between the price of a dozen roses and the quantity of roses a florist can sell.The slope between points B and C equals
(Multiple Choice)
4.9/5 (34)
When the Dallas Cowboys score more than 30 points in a game, they win the game.This is an example of
(Multiple Choice)
4.9/5 (36)
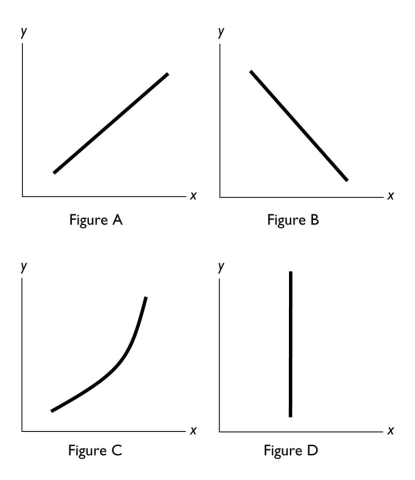 -In the diagram above, which figure(s) show(s) a direct relationship between the variables?
(Multiple Choice)
4.8/5 (34)
Filters
- Essay(0)
- Multiple Choice(0)
- Short Answer(0)
- True False(0)
- Matching(0)