Exam 1: Getting Started
Exam 1: Getting Started350 Questions
Exam 2: The Usand Global Economies199 Questions
Exam 3: The Economic Problem271 Questions
Exam 4: Demand and Supply317 Questions
Exam 5: Gdp: a Measure of Total Production and Income254 Questions
Exam 6: Jobs and Unemployment343 Questions
Exam 7: The Cpi and the Cost of Living265 Questions
Exam 8: Potential Gdp and the Natural Unemployment Rate207 Questions
Exam 9: Economic Growth267 Questions
Exam 10: Finance, Saving, and Investment269 Questions
Exam 11: The Monetary System361 Questions
Exam 12: Money, Interest, and Inflation261 Questions
Exam 13: Aggregate Supply and Aggregate Demand272 Questions
Exam 14: Aggregate Expenditure Multiplier311 Questions
Exam 15: The Short-Run Policy Tradeoff208 Questions
Exam 16: Fiscal Policy203 Questions
Exam 17: Monetary Policy188 Questions
Exam 18: International Trade Policy218 Questions
Exam 19: International Finance255 Questions
Select questions type
Most economic graphs have two lines perpendicular to each other.The vertical line is called the
(Multiple Choice)
4.8/5  (34)
(34)
List and explain the three fundamental economic questions that must be answered by all economic systems.
(Essay)
4.8/5 (37)
An independent relationship between two variables is shown in a graph by
(Multiple Choice)
4.8/5 (32)
If the marginal benefit of getting a college degree rises, rational people will
(Multiple Choice)
4.7/5 (37)
Discuss what is necessary to make rational decisions.Be sure to mention opportunity cost, marginal cost, and marginal benefit.
(Essay)
4.7/5 (39)
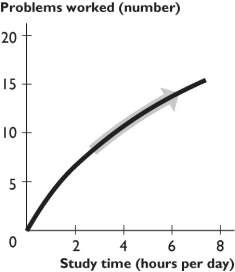 -The figure above shows the relationship between study time and the number of problems worked.The curve becomes less steep because as you study more,
(Multiple Choice)
4.9/5 (34)
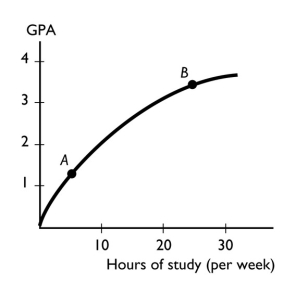 -The figure above shows the relationship between the time a student spends studying and the student's GPA that semester.This figure shows ________ relationship between the time spent studying and the GPA.
(Multiple Choice)
4.8/5 (33)
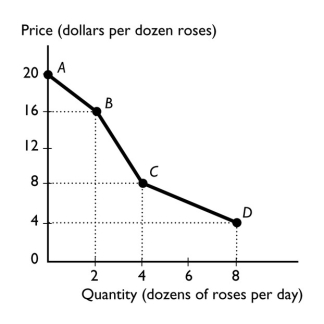 -The figure above shows the relationship between the price of a dozen roses and the quantity of roses a florist can sell.The relationship between the price and the quantity the florist can sell is
(Multiple Choice)
4.8/5 (36)
For spring break, Melanie will either stay home or go to Daytona Beach.At home, Melanie pays $10 per day for food and earns $90 a day at her job.At Daytona Beach, Melanie will stay with friends and so has no lodging cost.She will pay $20 per day for food.In terms of dollars, Melanie's opportunity cost per day of going to Daytona Beach is how much?
(Essay)
4.7/5 (30)
Filters
- Essay(0)
- Multiple Choice(0)
- Short Answer(0)
- True False(0)
- Matching(0)