Exam 1: Getting Started
Exam 1: Getting Started350 Questions
Exam 2: The Usand Global Economies199 Questions
Exam 3: The Economic Problem271 Questions
Exam 4: Demand and Supply317 Questions
Exam 5: Gdp: a Measure of Total Production and Income254 Questions
Exam 6: Jobs and Unemployment343 Questions
Exam 7: The Cpi and the Cost of Living265 Questions
Exam 8: Potential Gdp and the Natural Unemployment Rate207 Questions
Exam 9: Economic Growth267 Questions
Exam 10: Finance, Saving, and Investment269 Questions
Exam 11: The Monetary System361 Questions
Exam 12: Money, Interest, and Inflation261 Questions
Exam 13: Aggregate Supply and Aggregate Demand272 Questions
Exam 14: Aggregate Expenditure Multiplier311 Questions
Exam 15: The Short-Run Policy Tradeoff208 Questions
Exam 16: Fiscal Policy203 Questions
Exam 17: Monetary Policy188 Questions
Exam 18: International Trade Policy218 Questions
Exam 19: International Finance255 Questions
Select questions type
When economists use the term "correlation," they are referring to
(Multiple Choice)
4.8/5  (28)
(28)
When the federal government decides to pay senators more than it pays soldiers, it answers the ________ question.
(Multiple Choice)
4.8/5 (35)
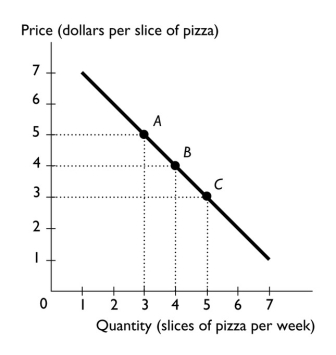 -The above figure shows the relationship between the price of a slice of pizza and how many slices of pizza Ricardo buys in a week.Between points A and B, the slope of the line equals
(Multiple Choice)
4.9/5 (34)
When unskilled teens earn less than college graduates, society answers the ________ question.
(Multiple Choice)
4.7/5 (39)
Of the three major economic questions, which of the following is the best example of a "How? " question?
(Multiple Choice)
4.8/5 (32)
A curve with a positive but decreasing slope represents a relationship where, every time the variable measured along the horizontal axis increases by one unit, the variable measured along the vertical axis
(Multiple Choice)
4.8/5 (28)
Hours studied (per week) SAT Scores 2 900 4 1000 6 1050 8 1075 10 1090
-Jamie is preparing to take his SAT tests.The table above shows how Jamie's score depends on the number of hours a week Jamie studies
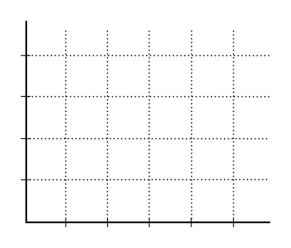
a. Plot the relationship in the figure, putting the hours studied on the horizontal axis.
 b. Is the relationship you plotted positive or negative?
c. What happens to the slope of the relationship as hours studied increase?
d. Suppose Jamie can enroll in an SAT prep course and, by so doing, for every possible number of hours he studies, his score will be 100 points higher.Plot the new relationship between the number of hours studied and Jamie's SAT score in the figure.
e. How many variables are involved in the figure you just completed?
b. Is the relationship you plotted positive or negative?
c. What happens to the slope of the relationship as hours studied increase?
d. Suppose Jamie can enroll in an SAT prep course and, by so doing, for every possible number of hours he studies, his score will be 100 points higher.Plot the new relationship between the number of hours studied and Jamie's SAT score in the figure.
e. How many variables are involved in the figure you just completed?
(Essay)
4.7/5 (33)
The marginal cost of an activity ________ as you do more of it.
(Multiple Choice)
4.8/5 (39)
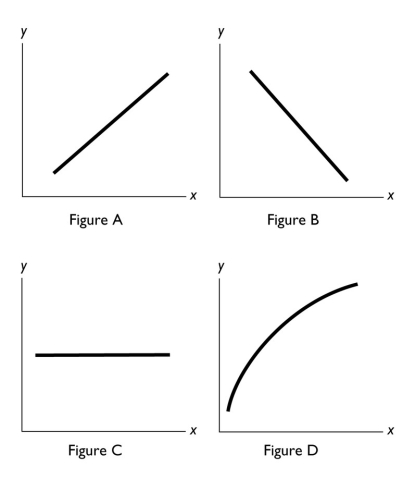 -In the above figure, which of the figures shows a relationship between x and y with a negative slope?
(Multiple Choice)
4.7/5 (45)
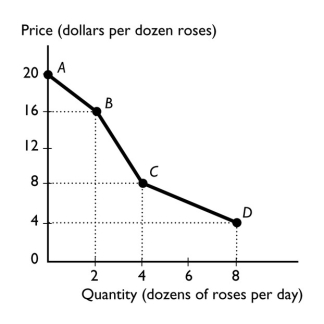 -The figure above shows the relationship between the price of a dozen roses and the quantity of roses a florist can sell.The slope between points C and D equals
(Multiple Choice)
4.8/5 (34)
When Ford decides to increase production of hybrid cars, it directly answers the ________ question.
(Multiple Choice)
4.9/5 (32)
A statement that "All children should receive free health care" is an example of what kind of statement?
(Multiple Choice)
4.8/5 (39)
Filters
- Essay(0)
- Multiple Choice(0)
- Short Answer(0)
- True False(0)
- Matching(0)