Exam 1: Getting Started
Exam 1: Getting Started350 Questions
Exam 2: The Usand Global Economies199 Questions
Exam 3: The Economic Problem271 Questions
Exam 4: Demand and Supply317 Questions
Exam 5: Gdp: a Measure of Total Production and Income254 Questions
Exam 6: Jobs and Unemployment343 Questions
Exam 7: The Cpi and the Cost of Living265 Questions
Exam 8: Potential Gdp and the Natural Unemployment Rate207 Questions
Exam 9: Economic Growth267 Questions
Exam 10: Finance, Saving, and Investment269 Questions
Exam 11: The Monetary System361 Questions
Exam 12: Money, Interest, and Inflation261 Questions
Exam 13: Aggregate Supply and Aggregate Demand272 Questions
Exam 14: Aggregate Expenditure Multiplier311 Questions
Exam 15: The Short-Run Policy Tradeoff208 Questions
Exam 16: Fiscal Policy203 Questions
Exam 17: Monetary Policy188 Questions
Exam 18: International Trade Policy218 Questions
Exam 19: International Finance255 Questions
Select questions type
Which of the following statements is the best example of the term ceteris paribus?
(Multiple Choice)
4.9/5  (41)
(41)
The slope of a line equals the change in the variable measured along the
(Multiple Choice)
4.8/5 (40)
Instead of studying for an additional two hours for the economics final, Leann decides to watch a movie.Leann is making
(Multiple Choice)
4.8/5 (28)
If the marginal benefit of the next slice of pizza exceeds the marginal cost, you will
(Multiple Choice)
4.9/5 (41)
Consider a diagram in which the variable measured on the y-axis remains constant while the variable measured on the x-axis increases.The graph of these two variables is a
(Multiple Choice)
4.9/5 (29)
To show the values of an economic variable for different groups in a population at a point in time, it is best to use a
(Multiple Choice)
4.8/5 (33)
Which of the following is true regarding this statement? "The president's decision to spend more money on national defense is smart."
(Multiple Choice)
4.7/5 (33)
In New State, the bottling law requires that people get a refund of five cents when they return an empty bottle or can.Why does the state pay people to return bottles?
In your answer, be sure to mention the role played by rational choice.
(Essay)
4.7/5 (29)
A graph shows the average SAT scores for males and females in 2010.The kind of graph used to show these data would be a
(Multiple Choice)
4.8/5 (40)
Which of the following statements is a positive statement?
(Multiple Choice)
4.8/5 (42)
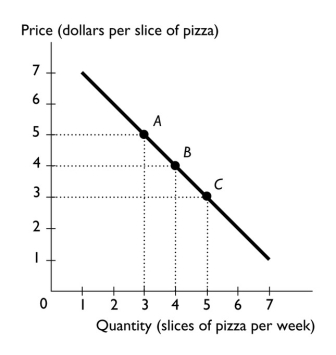 -The above figure shows the relationship between the price of a slice of pizza and how many slices of pizza Ricardo buys in a week.Between points A and B, the slope of the line is ________ the slope of the line between points B and C.
(Multiple Choice)
4.9/5 (27)
Choices that are best for the individuals that make them are choices in pursuit of
(Multiple Choice)
4.8/5 (30)
 -To graph a relationship that involves more than two variables, we use
(Multiple Choice)
4.8/5 (37)
The additional benefit of increasing some activity by one-unit is called the
(Multiple Choice)
4.9/5 (33)
Filters
- Essay(0)
- Multiple Choice(0)
- Short Answer(0)
- True False(0)
- Matching(0)