Exam 1: Getting Started
Exam 1: Getting Started350 Questions
Exam 2: The Usand Global Economies199 Questions
Exam 3: The Economic Problem271 Questions
Exam 4: Demand and Supply317 Questions
Exam 5: Gdp: a Measure of Total Production and Income254 Questions
Exam 6: Jobs and Unemployment343 Questions
Exam 7: The Cpi and the Cost of Living265 Questions
Exam 8: Potential Gdp and the Natural Unemployment Rate207 Questions
Exam 9: Economic Growth267 Questions
Exam 10: Finance, Saving, and Investment269 Questions
Exam 11: The Monetary System361 Questions
Exam 12: Money, Interest, and Inflation261 Questions
Exam 13: Aggregate Supply and Aggregate Demand272 Questions
Exam 14: Aggregate Expenditure Multiplier311 Questions
Exam 15: The Short-Run Policy Tradeoff208 Questions
Exam 16: Fiscal Policy203 Questions
Exam 17: Monetary Policy188 Questions
Exam 18: International Trade Policy218 Questions
Exam 19: International Finance255 Questions
Select questions type
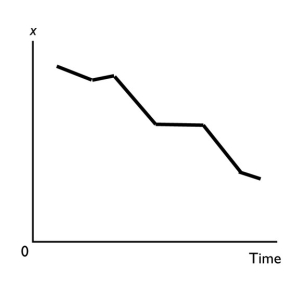 -A graph shows the average wage of various demographic groups in 2005.The kind of graph used to show these data would be a
(Multiple Choice)
4.9/5  (34)
(34)
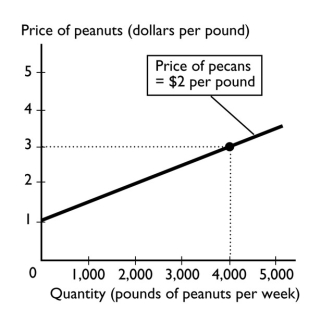 -The above figure shows how many pounds of peanuts farmers are willing to sell at different prices per pound of peanuts.If the price of a pound of peanuts is $1 and the price of a pound of pecans is $2, peanut farmers are willing to sell
(Multiple Choice)
4.8/5 (31)
To graph a relationship involving more than two variables, we use which assumption?
(Multiple Choice)
4.7/5 (38)
Which of the following is a topic studied in macroeconomics?
(Multiple Choice)
4.8/5 (39)
The statement that "increases in the tax on gasoline increase the price of gasoline" is an example of a
(Multiple Choice)
4.9/5 (26)
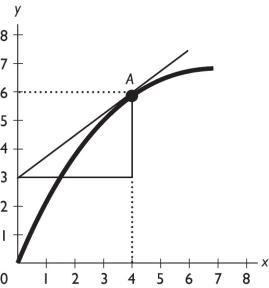 -In the figure above, what is the slope of the curve at point A?
(Multiple Choice)
5.0/5 (30)
What is the relationship between wants, resources, scarcity, and choices?
Discuss the relationship for an individual and for a society.
(Essay)
4.8/5 (29)
You have chosen to take a trip during Spring Break.If you had not gone, you would either have worked at a temporary job or studied for exams.The opportunity cost of your trip is
(Multiple Choice)
4.8/5 (36)
In order to study one more hour of economics, you must give up one hour of tennis.The hour of tennis is
(Multiple Choice)
4.8/5 (43)
In a graph, a straight line has a negative slope if the line
(Multiple Choice)
4.7/5 (32)
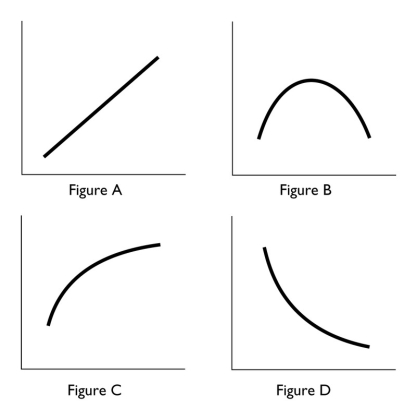 -In the above, which figure(s) show a relationship between the variables that is always negative?
(Multiple Choice)
4.9/5 (43)
Three variables are related and two of them are plotted in a figure.If the variable that is not measured on either the x-axis or the y-axis changes, then there is
(Multiple Choice)
4.8/5 (42)
Your economics professor offers 10 points extra credit if you attend a review session before your next exam. This extra credit is an example of
(Multiple Choice)
4.8/5 (36)
Filters
- Essay(0)
- Multiple Choice(0)
- Short Answer(0)
- True False(0)
- Matching(0)