Exam 1: Getting Started
Exam 1: Getting Started350 Questions
Exam 2: The Usand Global Economies199 Questions
Exam 3: The Economic Problem271 Questions
Exam 4: Demand and Supply317 Questions
Exam 5: Gdp: a Measure of Total Production and Income254 Questions
Exam 6: Jobs and Unemployment343 Questions
Exam 7: The Cpi and the Cost of Living265 Questions
Exam 8: Potential Gdp and the Natural Unemployment Rate207 Questions
Exam 9: Economic Growth267 Questions
Exam 10: Finance, Saving, and Investment269 Questions
Exam 11: The Monetary System361 Questions
Exam 12: Money, Interest, and Inflation261 Questions
Exam 13: Aggregate Supply and Aggregate Demand272 Questions
Exam 14: Aggregate Expenditure Multiplier311 Questions
Exam 15: The Short-Run Policy Tradeoff208 Questions
Exam 16: Fiscal Policy203 Questions
Exam 17: Monetary Policy188 Questions
Exam 18: International Trade Policy218 Questions
Exam 19: International Finance255 Questions
Select questions type
As the number of days without rain increases, the amount of wheat grown per acre declines.A graph showing this relationship shows
(Multiple Choice)
4.8/5  (28)
(28)
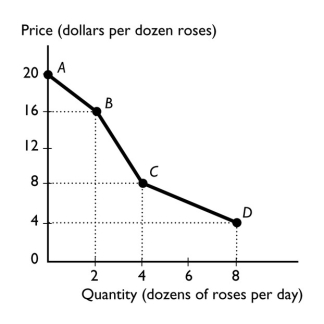 -The figure above shows the relationship between the price of a dozen roses and the quantity of roses a florist can sell.The slope between points A and B is
(Multiple Choice)
4.8/5 (29)
When a home builder decides to computerize all of its production schedule, it directly answers the ________ question.
(Multiple Choice)
4.7/5 (36)
We are investigating the relationship among three variables.We have graphed two of them.Suppose that the variable that is not measured on the x-axis or the y-axis changes.Then, there is
(Multiple Choice)
4.8/5 (30)
To show how a variable ________, we typically use a ________.
(Multiple Choice)
4.9/5 (32)
The tendency for the values of two variables to move in a predictable and related way is known as
(Multiple Choice)
4.9/5 (34)
When you make the decision to spend your time attending class, which economic question are you answering?
(Multiple Choice)
4.8/5 (41)
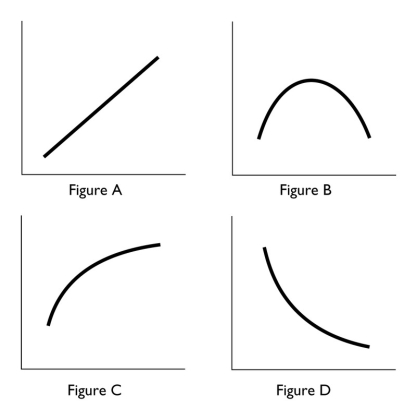 -In the above, which figure(s) has at least one point at which the slope equals zero?
(Multiple Choice)
4.9/5 (40)
To graph a relationship among several variables, we hold all but ________ variable(s) constant and use the ________ assumption.
(Multiple Choice)
4.7/5 (37)
Which of the following statements best describes the study of economics? Economics studies how
(Multiple Choice)
4.9/5 (40)
If Jessie studies economics for two hours instead of going to the movies with her friends, then
(Multiple Choice)
4.9/5 (27)
The question of "What goods and services get produced? " most closely relates to which of the following issues?
(Multiple Choice)
4.9/5 (38)
Filters
- Essay(0)
- Multiple Choice(0)
- Short Answer(0)
- True False(0)
- Matching(0)