Exam 1: Getting Started
Exam 1: Getting Started350 Questions
Exam 2: The Usand Global Economies199 Questions
Exam 3: The Economic Problem271 Questions
Exam 4: Demand and Supply317 Questions
Exam 5: Gdp: a Measure of Total Production and Income254 Questions
Exam 6: Jobs and Unemployment343 Questions
Exam 7: The Cpi and the Cost of Living265 Questions
Exam 8: Potential Gdp and the Natural Unemployment Rate207 Questions
Exam 9: Economic Growth267 Questions
Exam 10: Finance, Saving, and Investment269 Questions
Exam 11: The Monetary System361 Questions
Exam 12: Money, Interest, and Inflation261 Questions
Exam 13: Aggregate Supply and Aggregate Demand272 Questions
Exam 14: Aggregate Expenditure Multiplier311 Questions
Exam 15: The Short-Run Policy Tradeoff208 Questions
Exam 16: Fiscal Policy203 Questions
Exam 17: Monetary Policy188 Questions
Exam 18: International Trade Policy218 Questions
Exam 19: International Finance255 Questions
Select questions type
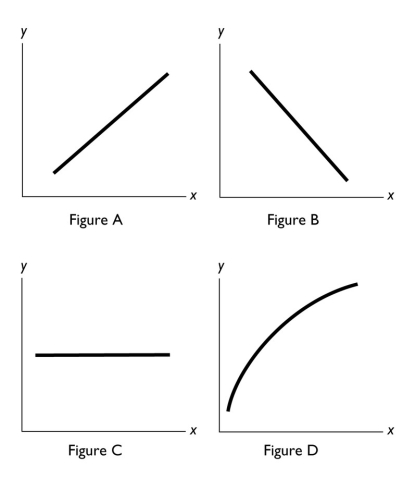 -In the above figure, a negative relationship between x and y is shown in Figure
(Multiple Choice)
4.8/5  (23)
(23)
Suppose you eat two hamburgers for lunch.The marginal benefit of the first burger is ________ of the second burger.
(Multiple Choice)
4.9/5 (33)
John has two hours of free time this evening.He ranked his alternatives, first go to a concert, second go to a movie, third study for an economics exam, and fourth answer his e-mail.What is the opportunity cost of attending the concert for John?
(Multiple Choice)
4.9/5 (34)
Which of the following statements is a normative statement?
(Multiple Choice)
4.9/5 (32)
Whether a company produces fishing rods mostly by hand or using high-tech machinery is a question of
(Multiple Choice)
5.0/5 (46)
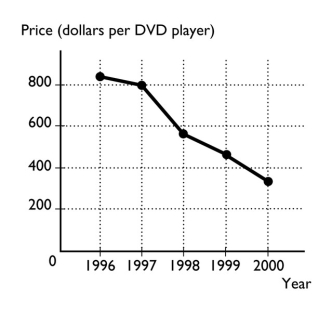 -The figure above shows the price of a DVD player from 1996 to 2000.
a. What type of graph is illustrated above?
b. What is the trend in the price of a DVD player?
-The figure above shows the price of a DVD player from 1996 to 2000.
a. What type of graph is illustrated above?
b. What is the trend in the price of a DVD player?
(Essay)
4.8/5 (42)
When Gabriel made a rational choice to spend his entire allowance on candy bars, he did so by comparing the
(Multiple Choice)
4.9/5 (28)
A graph shows the price of a pound of cucumbers on the vertical axis and the quantity of new cars sold by Honda on the horizontal axis.The price of a pound of cucumbers remains constant as the quantity of new cars sold increases.The graph of these data is a
(Multiple Choice)
4.8/5 (30)
You have data for the amount of rainfall in 50 cities for the month of June.The type of graph to best display these data would be a
(Multiple Choice)
4.9/5 (35)
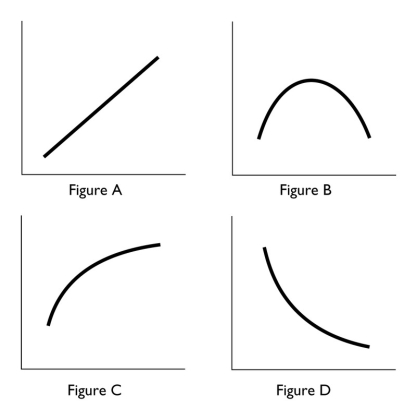 -In the above, which figure shows both a positive and a negative relationship between the variables?
(Multiple Choice)
4.9/5 (32)
Different nations answer the what, how, and for whom questions differently.China, for instance, builds dams using many workers and only a little capital equipment.The United States builds dams using a few workers and a lot of capital equipment.Which economic question are these two nations answering and why do the answers differ?
(Essay)
4.8/5 (40)
The ________ of something is the gain or pleasure that it brings.
(Multiple Choice)
4.9/5 (40)
The benefit from a good or service that you purchase is measured by
(Multiple Choice)
4.8/5 (37)
Filters
- Essay(0)
- Multiple Choice(0)
- Short Answer(0)
- True False(0)
- Matching(0)