Exam 1: Getting Started
Exam 1: Getting Started350 Questions
Exam 2: The Usand Global Economies199 Questions
Exam 3: The Economic Problem271 Questions
Exam 4: Demand and Supply317 Questions
Exam 5: Gdp: a Measure of Total Production and Income254 Questions
Exam 6: Jobs and Unemployment343 Questions
Exam 7: The Cpi and the Cost of Living265 Questions
Exam 8: Potential Gdp and the Natural Unemployment Rate207 Questions
Exam 9: Economic Growth267 Questions
Exam 10: Finance, Saving, and Investment269 Questions
Exam 11: The Monetary System361 Questions
Exam 12: Money, Interest, and Inflation261 Questions
Exam 13: Aggregate Supply and Aggregate Demand272 Questions
Exam 14: Aggregate Expenditure Multiplier311 Questions
Exam 15: The Short-Run Policy Tradeoff208 Questions
Exam 16: Fiscal Policy203 Questions
Exam 17: Monetary Policy188 Questions
Exam 18: International Trade Policy218 Questions
Exam 19: International Finance255 Questions
Select questions type
You have data for sales of pizza for each of the 50 states in 2010.The type of graph to best display these data would be a
(Multiple Choice)
4.9/5  (26)
(26)
If x increases and as a result y decreases, then x and y are
(Multiple Choice)
4.8/5 (43)
Suppose you decide to attend summer school and that this is considered a rational choice.When making this choice,
(Multiple Choice)
4.8/5 (36)
Which of the following is NOT a normative economic statement?
(Multiple Choice)
4.9/5 (33)
Which of the following is true regarding a normative statement?
I.It uses the ceteris paribus assumption.
Ii. It is a value judgment.
Iii. It accounts for opportunity costs.
(Multiple Choice)
4.8/5 (35)
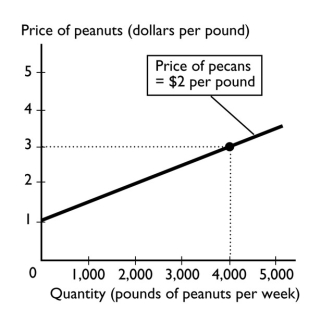 -In the figure above, suppose the price of a pound of pecans is negatively related to the quantity of peanuts that farmers are willing to supply.If the price of pecans increases,
(Multiple Choice)
4.8/5 (41)
A graph that shows how the amount of advertising expenditure differs among various industries can be shown
(Multiple Choice)
4.7/5 (34)
As a shoe factory adds more workers, shoe production grows, reaches a maximum, and then shrinks.In a diagram that has the number of workers on the horizontal axis and the number of shoes on the vertical axis, the relationship between the number of workers and the number of shoes starts as ________ and then, after the maximum point, is ________.
(Multiple Choice)
4.9/5 (25)
Normative statements i. describe how the world is.
Ii) describe how the world ought to be.
Iii) depend on people's values and cannot be tested.
(Multiple Choice)
4.8/5 (31)
 -A graph shows that the number of U.S.tourists visiting a Caribbean island increases as the temperature in the northeastern United States falls.The graph shows
(Multiple Choice)
4.8/5 (27)
Which of the following statements is a normative statement?
(Multiple Choice)
4.9/5 (24)
x variable (on the horizontal axis) y variable (on the vertical axis) 100 50 200 125 300 200
-The table above shows data on two variables.If these data were graphed, the slope of the line would be
(Multiple Choice)
4.9/5 (29)
Because human wants are insatiable and unlimited while available resources are limited, people are said to face the problem of
(Multiple Choice)
4.8/5 (32)
Filters
- Essay(0)
- Multiple Choice(0)
- Short Answer(0)
- True False(0)
- Matching(0)