Exam 11: Simple Regression
Exam 1: Describing Data: Graphical247 Questions
Exam 2: Describing Data: Numerical326 Questions
Exam 3: Probability345 Questions
Exam 4: Discrete Random Variables and Probability Distributions257 Questions
Exam 5: Continuous Random Variables and Probability Distributions239 Questions
Exam 6: Sampling and Sampling Distributions147 Questions
Exam 7: Estimation: Single Population151 Questions
Exam 8: Estimation: Additional Topics109 Questions
Exam 9: Hypothesis Testing: Single Population164 Questions
Exam 10: Hypothesis Testing: Additional Topics103 Questions
Exam 11: Simple Regression217 Questions
Exam 12: Multiple Regression252 Questions
Exam 13: Additional Topics in Regression Analysis168 Questions
Exam 14: Analysis of Categorical Data241 Questions
Exam 15: Analysis of Variance192 Questions
Exam 16: Time-Series Analysis and Forecasting138 Questions
Exam 17: Additional Topics in Sampling110 Questions
Select questions type
THE NEXT QUESTIONS ARE BASED ON THE FOLLOWING INFORMATION:
For a sample of 20 monthly observations a financial analyst wants to regress the percentage rate of return (y)of the common stock of a corporation on the percentage rate of return (x)of the Standard and Poor's 500 Index.The following summary statistics are available:  ,
,  ,
, 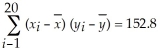 ,and
,and 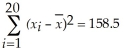 -Estimate the linear regression of y on x.
(Essay)
4.8/5  (35)
(35)
A correlation coefficient equal to -1 or +1 indicates perfect correlation.
(True/False)
4.9/5 (38)
The uniform variance assumption for the linear regression model states that the error terms are random variables with a mean equal to one and the same variance.
(True/False)
4.7/5 (35)
THE NEXT QUESTIONS ARE BASED ON THE FOLLOWING INFORMATION:
An insurance company analyst is interested in analyzing the dollar value of damage in automobile accidents.She collects data from 115 accidents,and records the amount of damage as well as the age of the driver.The results of her regression analysis are listed below.
SUMMARY OUTPUT 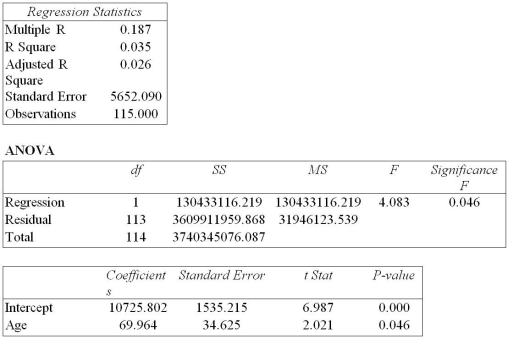 -The regression equation is:
(Multiple Choice)
4.8/5 (39)
THE NEXT QUESTIONS ARE BASED ON THE FOLLOWING INFORMATION:
The manager of a used-car dealership is very interested in the resale price of used cars.The manager feels that the age of the car is important in determining the resale value.He collects data on the age and resale value of 15 cars and runs a regression analysis with the value of the car (in thousands of dollars)as the dependent variable and the age of the car (in years)as the independent variable.Unfortunately,the printout had lost some of the results,identified by"A" through"F".The partial results left are displayed below. 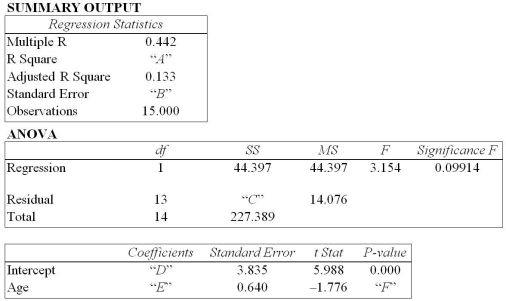 -In order to estimate with 95% confidence the expected value of y in a simple linear regression problem,a random sample of 10 observations is taken.Which of the following t-table values listed below would be used?
(Multiple Choice)
4.9/5 (31)
When testing the strength of the relationship between two variables,the null hypothesis of interest is H0 : ρ = 0.
(True/False)
4.9/5 (31)
THE NEXT QUESTIONS ARE BASED ON THE FOLLOWING INFORMATION:
The manager of a used-car dealership is very interested in the resale price of used cars.The manager feels that the age of the car is important in determining the resale value.He collects data on the age and resale value of 15 cars and runs a regression analysis with the value of the car (in thousands of dollars)as the dependent variable and the age of the car (in years)as the independent variable.Unfortunately,the printout had lost some of the results,identified by"A" through"F".The partial results left are displayed below.
-Compute the value of "D."
(Multiple Choice)
4.8/5 (38)
THE NEXT QUESTIONS ARE BASED ON THE FOLLOWING INFORMATION:
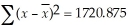
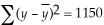
The data below are for the number of unemployed persons (in millions)and the federal unemployment insurance payments (in billions of dollars)for the years 1978-1985.Some economists state that these two variables are positively related.
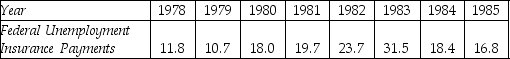
 -Calculate the estimated standard deviation of the slope.
(Essay)
4.8/5 (31)
THE NEXT QUESTIONS ARE BASED ON THE FOLLOWING INFORMATION:
It was hypothesized that the number of bottles of an imported premium beer sold per evening in the restaurants of a city depends linearly on the average costs of meals in the restaurants.The following results were obtained for a sample of n = 20 restaurants,of approximately equal size,  = 30.0,
  = 18.8,
  = 412,
 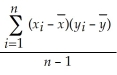 = 212
Where,y = Number of bottles sold per evening and x = Average costs,in dollars,of a meal.
-Interpret the slope of the sample regression line.
= 212
Where,y = Number of bottles sold per evening and x = Average costs,in dollars,of a meal.
-Interpret the slope of the sample regression line.
(Essay)
4.9/5 (37)
THE NEXT QUESTIONS ARE BASED ON THE FOLLOWING INFORMATION:
The following regression statistics are given: sample size is 40,SST = 1000,and the correlation between x and y is 0.70.
-Compute the error sum of squares,SSE.
(Essay)
4.8/5 (29)
THE NEXT QUESTIONS ARE BASED ON THE FOLLOWING INFORMATION:
A sample of 8 households was asked about their monthly income (x)and the number of hours they spend connected to the internet each month (y).The data yield the following statistics:  ,
,  ,
,  ,
,  ,
, 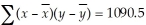 -Determine the estimate of the variance of the population model error.
(Multiple Choice)
4.8/5 (36)
When we compute the sample correlation r from data,the result will be definitely zero when the population correlation ρ is zero.
(True/False)
4.8/5 (42)
The smaller the sample size,the smaller the standard error of estimate.
(True/False)
4.9/5 (32)
THE NEXT QUESTIONS ARE BASED ON THE FOLLOWING INFORMATION:
A college administers for all its courses a student evaluation questionnaire.For a random sample 12 courses the accompanying table shows both the average student ratings of the instructor (on a scale from 1 to 5),and the average expected grades of the students (on a scale from 0 to 4).
 -Test at the 10% significance level the hypothesis that the population correlation coefficient is zero against the alternative that it is positive.
(Essay)
4.8/5 (42)
THE NEXT QUESTIONS ARE BASED ON THE FOLLOWING INFORMATION:
Given a simple regression analysis,suppose that we have obtained the fitted regression model:  i = 6 + 8xi and also the following statistics: se = 3.20,
  = 8,n = 42,and
 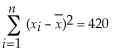 -Find the 95% confidence interval for the point where x =18.
(Essay)
4.7/5 (41)
What is the correlation coefficient for the stock returns of the two years? What sign does it have? Why?
(Essay)
4.9/5 (41)
THE NEXT QUESTIONS ARE BASED ON THE FOLLOWING INFORMATION:
A professor of statistics is interested in studying the relationship between the number of hours graduate students spent studying for his comprehensive final exam and the exam score.The results of the regression analysis of hours studied on exam scores are presented below. 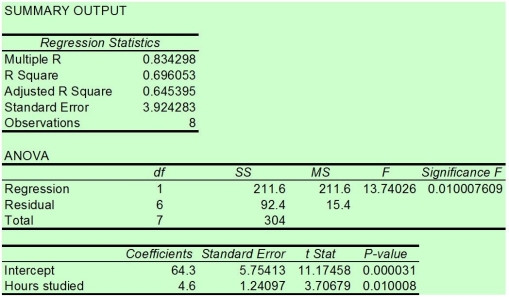 -Which of the following is used to plot the dependent variable versus the independent variable?
(Multiple Choice)
4.9/5 (38)
The forecaster obtained an estimated equation for the regression of weekly sales of ice cream and the prices during the week.Help the forecaster to interpret the constant b0 for the product brand manager.
(Essay)
4.8/5 (31)
Filters
- Essay(0)
- Multiple Choice(0)
- Short Answer(0)
- True False(0)
- Matching(0)