Exam 11: Simple Regression
Exam 1: Describing Data: Graphical247 Questions
Exam 2: Describing Data: Numerical326 Questions
Exam 3: Probability345 Questions
Exam 4: Discrete Random Variables and Probability Distributions257 Questions
Exam 5: Continuous Random Variables and Probability Distributions239 Questions
Exam 6: Sampling and Sampling Distributions147 Questions
Exam 7: Estimation: Single Population151 Questions
Exam 8: Estimation: Additional Topics109 Questions
Exam 9: Hypothesis Testing: Single Population164 Questions
Exam 10: Hypothesis Testing: Additional Topics103 Questions
Exam 11: Simple Regression217 Questions
Exam 12: Multiple Regression252 Questions
Exam 13: Additional Topics in Regression Analysis168 Questions
Exam 14: Analysis of Categorical Data241 Questions
Exam 15: Analysis of Variance192 Questions
Exam 16: Time-Series Analysis and Forecasting138 Questions
Exam 17: Additional Topics in Sampling110 Questions
Select questions type
THE NEXT QUESTIONS ARE BASED ON THE FOLLOWING INFORMATION:
A professor of statistics is interested in studying the relationship between the number of hours graduate students spent studying for his comprehensive final exam and the exam score.The results of the regression analysis of hours studied on exam scores are presented below. 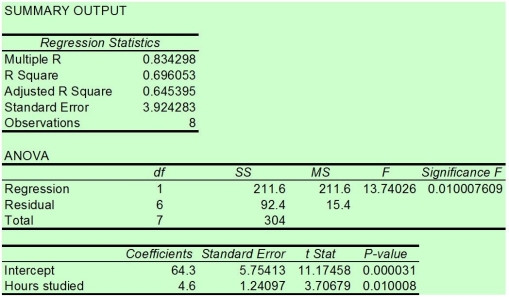 -Using financial analysis based on the capital asset pricing model,the required return on an investment is given by:
(Multiple Choice)
4.9/5  (38)
(38)
THE NEXT QUESTIONS ARE BASED ON THE FOLLOWING INFORMATION:
A professor of statistics is interested in studying the relationship between the number of hours graduate students spent studying for his comprehensive final exam and the exam score.The results of the regression analysis of hours studied on exam scores are presented below.
-What is the approximate point estimate of the final exam score for a student who has studied for 5.45 hours?
(Multiple Choice)
4.8/5 (28)
THE NEXT QUESTIONS ARE BASED ON THE FOLLOWING INFORMATION:
A professor of statistics is interested in studying the relationship between the number of hours graduate students spent studying for his comprehensive final exam and the exam score.The results of the regression analysis of hours studied on exam scores are presented below.
-For the given data,what is/are the critical value(s)for testing the hypotheses at 0.05 level of significance?
(Multiple Choice)
4.8/5 (38)
THE NEXT QUESTIONS ARE BASED ON THE FOLLOWING INFORMATION:
A professor of statistics is interested in studying the relationship between the number of hours graduate students spent studying for his comprehensive final exam and the exam score.The results of the regression analysis of hours studied on exam scores are presented below.
-What is the value of the test statistic for testing H0 : ρ = 0 vs.Ha : ρ >0?
(Multiple Choice)
4.8/5 (37)
In simple linear regression,the fit of the regression equation to the data is improved as error sum of squares increases and regression sum of squares decreases.
(True/False)
4.7/5 (42)
THE NEXT QUESTIONS ARE BASED ON THE FOLLOWING INFORMATION:
A sample of 8 households was asked about their monthly income (x)and the number of hours they spend connected to the internet each month (y).The data yield the following statistics:  ,
,  ,
, 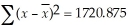 ,
, 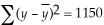 ,
, 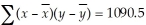 -The slope of the regression line of hours on income is:
(Multiple Choice)
4.8/5 (27)
THE NEXT QUESTIONS ARE BASED ON THE FOLLOWING INFORMATION:
You want to explore the relationship between the scores students receive on their first quiz and their first exam.You believe that there is a positive correlation between the two scores.
-What is the appropriate decision rule?
(Multiple Choice)
4.8/5 (37)
The width of the confidence interval estimate for the average value of y does not depend on the standard error of the estimate.
(True/False)
4.8/5 (30)
THE NEXT QUESTIONS ARE BASED ON THE FOLLOWING INFORMATION:
A professor of statistics is interested in studying the relationship between the number of hours graduate students spent studying for his comprehensive final exam and the exam score.The results of the regression analysis of hours studied on exam scores are presented below.
-For the given data,which of the following is the result of the hypothesis test?
(Multiple Choice)
4.7/5 (46)
Which of the following statements is the best explanation of the R2?
(Multiple Choice)
4.9/5 (37)
The t-test for the true slope β1 = 0 is identical to the t-test for the true correlation ρ = 0.
(True/False)
4.9/5 (33)
THE NEXT QUESTIONS ARE BASED ON THE FOLLOWING INFORMATION:
For a sample of 20 monthly observations a financial analyst wants to regress the percentage rate of return (y)of the common stock of a corporation on the percentage rate of return (x)of the Standard and Poor's 500 Index.The following summary statistics are available:  ,
,  ,
, 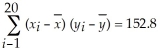 ,and
,and 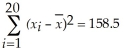 -Interpret the intercept of the sample regression line.
(Essay)
4.9/5 (41)
THE NEXT QUESTIONS ARE BASED ON THE FOLLOWING INFORMATION:
Consider the following values of variables x and y:
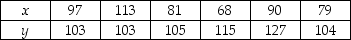 -Construct a scatter diagram of the data points.
(Essay)
4.9/5 (35)
THE NEXT QUESTIONS ARE BASED ON THE FOLLOWING INFORMATION:
The following regression statistics are given: sample size is 40,SST = 1000,and the correlation between x and y is 0.70.
-Use a simple regression model to test the hypothesis: H0 : β1 = 0 vs.H1 : β1 ≠ 0 ,with α = 0.05
(Essay)
4.9/5 (31)
THE NEXT QUESTIONS ARE BASED ON THE FOLLOWING INFORMATION:
Suppose we have the following information from a simple regression:
b0= 117.4,b1 = -14.39,s  = 0.18,s
  = 0.18,n = 300,
  = 4.3,SST = 17,045,and SSE = 12,053.
-What is the coefficient of determination?
= 4.3,SST = 17,045,and SSE = 12,053.
-What is the coefficient of determination?
(Multiple Choice)
4.8/5 (27)
THE NEXT QUESTIONS ARE BASED ON THE FOLLOWING INFORMATION:
Given a simple regression analysis,suppose that we have obtained the fitted regression model:  i = 6 + 8xi and also the following statistics: se = 3.20,
  = 8,n = 42,and
 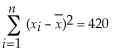 -Find the 95% prediction interval for the point where x =18.
(Essay)
4.9/5 (35)
THE NEXT QUESTIONS ARE BASED ON THE FOLLOWING INFORMATION:
A professor of statistics is interested in studying the relationship between the number of hours graduate students spent studying for his comprehensive final exam and the exam score.The results of the regression analysis of hours studied on exam scores are presented below.
-What does a coefficient of correlation of 0.80 indicate?
(Multiple Choice)
4.9/5 (37)
The coefficient of determination represents the ratio of SSR to SST.
(True/False)
5.0/5 (31)
Filters
- Essay(0)
- Multiple Choice(0)
- Short Answer(0)
- True False(0)
- Matching(0)