Exam 11: Simple Regression
Exam 1: Describing Data: Graphical247 Questions
Exam 2: Describing Data: Numerical326 Questions
Exam 3: Probability345 Questions
Exam 4: Discrete Random Variables and Probability Distributions257 Questions
Exam 5: Continuous Random Variables and Probability Distributions239 Questions
Exam 6: Sampling and Sampling Distributions147 Questions
Exam 7: Estimation: Single Population151 Questions
Exam 8: Estimation: Additional Topics109 Questions
Exam 9: Hypothesis Testing: Single Population164 Questions
Exam 10: Hypothesis Testing: Additional Topics103 Questions
Exam 11: Simple Regression217 Questions
Exam 12: Multiple Regression252 Questions
Exam 13: Additional Topics in Regression Analysis168 Questions
Exam 14: Analysis of Categorical Data241 Questions
Exam 15: Analysis of Variance192 Questions
Exam 16: Time-Series Analysis and Forecasting138 Questions
Exam 17: Additional Topics in Sampling110 Questions
Select questions type
THE NEXT QUESTIONS ARE BASED ON THE FOLLOWING INFORMATION:
You are interested in exploring the relationship between the income of professors (measured in thousands of dollars)and the number of years they have been employed by the university.You collect the following data from eight professors.
 -Use a computer to run the simple linear regression analysis of income on length of employment.
(Essay)
4.9/5  (47)
(47)
If the coefficient of determination is 0.64,the correlation coefficient must be 0.80.
(True/False)
4.8/5 (34)
THE NEXT QUESTIONS ARE BASED ON THE FOLLOWING INFORMATION:
A professor of statistics is interested in studying the relationship between the number of hours graduate students spent studying for his comprehensive final exam and the exam score.The results of the regression analysis of hours studied on exam scores are presented below. 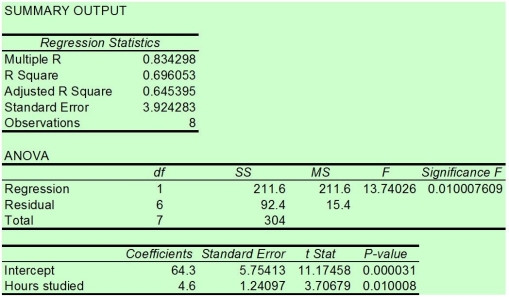 -Which of the following statements must be true,if the regression sum of squares (SSR)is 83.6?
(Multiple Choice)
4.8/5 (36)
The management of a local hotel is interested in determining the optimal staffing of the dining room.They believe that the number of overnight guests may help in determining the number of dinners to be served on a particular evening.They collected some data and ran a linear regression.The equation of the regression line is given by:
Number of dinners served = 120 + 0.60 Number of overnight guests.
Interpret these results for the hotel management.
(Essay)
4.9/5 (36)
Which of the following will tend to make it more likely to reject H0 : β1 = 0?
(Multiple Choice)
4.7/5 (43)
Nondiversifiable risk is that risk associated with specific firms and industries and includes labor conflicts,new competition,consumer market changes,and many other factors.
(True/False)
4.7/5 (33)
A t-test is used to test the significance of the coefficient of correlation.
(True/False)
4.9/5 (40)
THE NEXT QUESTIONS ARE BASED ON THE FOLLOWING INFORMATION:
A professor of statistics is interested in studying the relationship between the number of hours graduate students spent studying for his comprehensive final exam and the exam score.The results of the regression analysis of hours studied on exam scores are presented below.
-If the least squares regression line  = -2.88 + 1.77x and the coefficient of determination is 0.81,the coefficient of correlation is:
(Multiple Choice)
4.8/5 (37)
THE NEXT QUESTIONS ARE BASED ON THE FOLLOWING INFORMATION:
Consider a random sample of 25 observations of two variables x and y.The following summary statistics are available:  = 43.2,
  = 195.6,
  = 1357.2,
  = 1253.4,and
 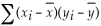 = 4843.6.
-Which of the following is the slope of the sample regression line?
= 4843.6.
-Which of the following is the slope of the sample regression line?
(Multiple Choice)
4.8/5 (37)
THE NEXT QUESTIONS ARE BASED ON THE FOLLOWING INFORMATION:
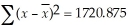
Given a simple regression analysis,suppose that we have obtained the fitted regression model:  i = 6 + 8xi and also the following statistics: se = 3.20,
  = 8,n = 42,and
 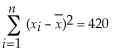 -A scatter diagram includes the data points (x = 2,y = 5),(x = 4,y = 12),(x = 6,y = 20),(x = 8,y = 28),and (x = 10,y = 30).Two regression lines are proposed: (1)
  = -0.6 + 3x,and (2)
  = -1 + 5x.Using the least squares criterion,which of these regression lines is the better fit to the data? Why?
(Essay)
4.8/5 (39)
THE NEXT QUESTIONS ARE BASED ON THE FOLLOWING INFORMATION:
A sample of 8 households was asked about their monthly income (x)and the number of hours they spend connected to the internet each month (y).The data yield the following statistics:  ,
,  ,
,  ,
, 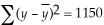 ,
, 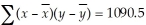 -What is the standard deviation of the number of hours households spend connected to the internet each month?
(Multiple Choice)
4.9/5 (33)
THE NEXT QUESTIONS ARE BASED ON THE FOLLOWING INFORMATION:
The data below are for the number of unemployed persons (in millions)and the federal unemployment insurance payments (in billions of dollars)for the years 1978-1985.Some economists state that these two variables are positively related.
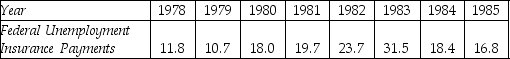
 -Construct 95% confidence interval for the slope of the population regression line.
(Essay)
4.9/5 (39)
The vertical spread of the data points about the regression line is measured by the:
(Multiple Choice)
4.8/5 (32)
THE NEXT QUESTIONS ARE BASED ON THE FOLLOWING INFORMATION:
A college administers for all its courses a student evaluation questionnaire.For a random sample 12 courses the accompanying table shows both the average student ratings of the instructor (on a scale from 1 to 5),and the average expected grades of the students (on a scale from 0 to 4).
 -Calculate the sample correlation coefficient between instructor ratings and expected grades.
(Essay)
4.9/5 (36)
THE NEXT QUESTIONS ARE BASED ON THE FOLLOWING INFORMATION:
The data below are for the number of unemployed persons (in millions)and the federal unemployment insurance payments (in billions of dollars)for the years 1978-1985.Some economists state that these two variables are positively related.
-Calculate the coefficient of correlation.
(Essay)
4.7/5 (50)
THE NEXT QUESTIONS ARE BASED ON THE FOLLOWING INFORMATION:
A professor of statistics is interested in studying the relationship between the number of hours graduate students spent studying for his comprehensive final exam and the exam score.The results of the regression analysis of hours studied on exam scores are presented below.
-The value of the coefficient of determination is:
(Multiple Choice)
4.9/5 (36)
Filters
- Essay(0)
- Multiple Choice(0)
- Short Answer(0)
- True False(0)
- Matching(0)