Exam 11: Simple Regression
Exam 1: Describing Data: Graphical247 Questions
Exam 2: Describing Data: Numerical326 Questions
Exam 3: Probability345 Questions
Exam 4: Discrete Random Variables and Probability Distributions257 Questions
Exam 5: Continuous Random Variables and Probability Distributions239 Questions
Exam 6: Sampling and Sampling Distributions147 Questions
Exam 7: Estimation: Single Population151 Questions
Exam 8: Estimation: Additional Topics109 Questions
Exam 9: Hypothesis Testing: Single Population164 Questions
Exam 10: Hypothesis Testing: Additional Topics103 Questions
Exam 11: Simple Regression217 Questions
Exam 12: Multiple Regression252 Questions
Exam 13: Additional Topics in Regression Analysis168 Questions
Exam 14: Analysis of Categorical Data241 Questions
Exam 15: Analysis of Variance192 Questions
Exam 16: Time-Series Analysis and Forecasting138 Questions
Exam 17: Additional Topics in Sampling110 Questions
Select questions type
You are interested in understanding why some people send more e-mail messages than others do.One possible explanation may be the age of the individual.Older people tend to be less computer savvy,and may have fewer friends who use e-mail.You examine the number of e-mails a person sends weekly using regression analysis and come up with the following equation of the regression line:
Number of e-mails = 63 - 0.5 Age.Interpret these results.
(Essay)
4.8/5  (41)
(41)
THE NEXT QUESTIONS ARE BASED ON THE FOLLOWING INFORMATION:
Suppose we have the following information from a simple regression:
b0= 117.4,b1 = -14.39,s  = 0.18,s
  = 0.18,n = 300,
  = 4.3,SST = 17,045,and SSE = 12,053.
-Which of the following would most likely represent a 95% confidence interval for the estimate of y,given x =
= 4.3,SST = 17,045,and SSE = 12,053.
-Which of the following would most likely represent a 95% confidence interval for the estimate of y,given x =  ?
?
(Multiple Choice)
4.8/5 (42)
The strength of the correlation between two variables depends on the sign of the coefficient of correlation.
(True/False)
4.8/5 (40)
THE NEXT QUESTIONS ARE BASED ON THE FOLLOWING INFORMATION:
You are interested in determining the relationship between x and y.You have the following information:
b0= 117.4,b1= -14.39,s  = 0.18,s
  = 0.18,n = 300,
  = 4.3,SST = 17045,and SSE = 12053.
-What is the sample mean of y?
= 4.3,SST = 17045,and SSE = 12053.
-What is the sample mean of y?
(Essay)
4.8/5 (25)
THE NEXT QUESTIONS ARE BASED ON THE FOLLOWING INFORMATION:
The data below are for the number of unemployed persons (in millions)and the federal unemployment insurance payments (in billions of dollars)for the years 1978-1985.Some economists state that these two variables are positively related.
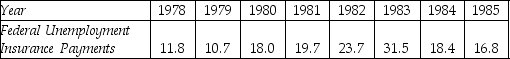
 -Test the null hypothesis that the true population coefficient of correlation equals zero using the 0.05 significance level.
(Essay)
4.8/5 (38)
THE NEXT QUESTIONS ARE BASED ON THE FOLLOWING INFORMATION:
Suppose we have the following information from a simple regression:
b0= 117.4,b1 = -14.39,s
= 0.18,s
= 0.18,n = 300,
= 4.3,SST = 17,045,and SSE = 12,053.
-Determine the sample mean of y.
(Multiple Choice)
4.9/5 (39)
THE NEXT QUESTIONS ARE BASED ON THE FOLLOWING INFORMATION:
The results of a regression analysis are listed below but,unfortunately,some values as identified by asterisks are missing.
SUMMARY OUTPUT 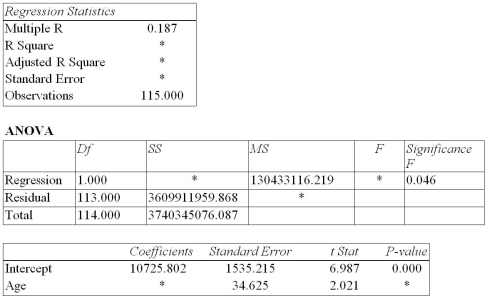 -Determine the mean square error.
(Essay)
4.9/5 (39)
THE NEXT QUESTIONS ARE BASED ON THE FOLLOWING INFORMATION:
It was hypothesized that the number of bottles of an imported premium beer sold per evening in the restaurants of a city depends linearly on the average costs of meals in the restaurants.The following results were obtained for a sample of n = 20 restaurants,of approximately equal size,  = 30.0,
  = 18.8,
  = 412,
 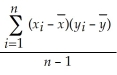 = 212
Where,y = Number of bottles sold per evening and x = Average costs,in dollars,of a meal.
-Is it possible to provide a meaningful interpretation of the intercept of the sample regression line? Explain.
= 212
Where,y = Number of bottles sold per evening and x = Average costs,in dollars,of a meal.
-Is it possible to provide a meaningful interpretation of the intercept of the sample regression line? Explain.
(Essay)
4.8/5 (28)
THE NEXT QUESTIONS ARE BASED ON THE FOLLOWING INFORMATION:
The data below are for the number of unemployed persons (in millions)and the federal unemployment insurance payments (in billions of dollars)for the years 1978-1985.Some economists state that these two variables are positively related.
-What does the scatter diagram indicate about the relationship between these two variables?
(Essay)
4.9/5 (42)
You give a pre-employment examination to your applicants.The test is scored from 1 to 100.You have data on their sales at the end of one year measured in dollars.You want to know if there is any linear relationship between pre-employment examination score and sales.An appropriate test to use is the t-test on the population correlation coefficient.
(True/False)
4.7/5 (39)
THE NEXT QUESTIONS ARE BASED ON THE FOLLOWING INFORMATION:
It was hypothesized that the number of bottles of an imported premium beer sold per evening in the restaurants of a city depends linearly on the average costs of meals in the restaurants.The following results were obtained for a sample of n = 20 restaurants,of approximately equal size,
= 30.0,
= 18.8,
= 412,
= 212
Where,y = Number of bottles sold per evening and x = Average costs,in dollars,of a meal.
-Determine the sample regression line.
(Essay)
4.9/5 (40)
THE NEXT QUESTIONS ARE BASED ON THE FOLLOWING INFORMATION:
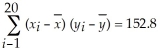
You want to explore the relationship between the grades students receive on their first quiz (x)and their first exam (y).The first quiz and test scores for a sample of eight students reveal the following summary statistics:  -What is the covariance between x and y?
(Multiple Choice)
4.9/5 (37)
THE NEXT QUESTIONS ARE BASED ON THE FOLLOWING:
The below sample data set shows the relationship between two variables.
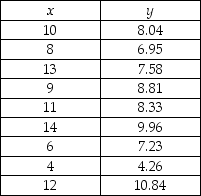 -What is the value of cov(x,y)?
(Multiple Choice)
4.8/5 (37)
THE NEXT QUESTIONS ARE BASED ON THE FOLLOWING INFORMATION:
For a sample of 20 monthly observations a financial analyst wants to regress the percentage rate of return (y)of the common stock of a corporation on the percentage rate of return (x)of the Standard and Poor's 500 Index.The following summary statistics are available:  ,
,  ,
,  ,and
,and 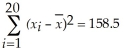 -Interpret the slope of the sample regression line.
(Essay)
4.7/5 (29)
The coefficient of determination can only take on positive values.
(True/False)
4.7/5 (27)
THE NEXT QUESTIONS ARE BASED ON THE FOLLOWING INFORMATION:
You are interested in determining the relationship between x and y.You have the following information:
b0= 117.4,b1= -14.39,s
= 0.18,s
= 0.18,n = 300,
= 4.3,SST = 17045,and SSE = 12053.
-Using regression techniques,we can plot a scatter diagram and plot a line to the data using the Least Squares method.Generally,the points do not fall directly on the line.Why does this happen? Is it a problem?
(Essay)
4.7/5 (35)
THE NEXT QUESTIONS ARE BASED ON THE FOLLOWING INFORMATION:
The results of a regression analysis are listed below but,unfortunately,some values as identified by asterisks are missing.
SUMMARY OUTPUT
-Calculate the regression sum of squares.
(Essay)
4.8/5 (36)
THE NEXT QUESTIONS ARE BASED ON THE FOLLOWING INFORMATION:
Suppose that you are interested in the relationship between the return rate on a stock in 2010 compared to the return rate in 2009.You believe that the return rates in both years are positively correlated.A sample of 15 stocks yields the following regression results: b0= 5.3,b1= 1.04,s  = 1.79,s
  = 0.2163,R2 = 0.64,and MSE = 35.4.
-How would you explain the slope coefficient b1?
= 0.2163,R2 = 0.64,and MSE = 35.4.
-How would you explain the slope coefficient b1?
(Essay)
4.9/5 (38)
Filters
- Essay(0)
- Multiple Choice(0)
- Short Answer(0)
- True False(0)
- Matching(0)