Exam 12: Multiple Regression
Exam 1: Describing Data: Graphical247 Questions
Exam 2: Describing Data: Numerical326 Questions
Exam 3: Probability345 Questions
Exam 4: Discrete Random Variables and Probability Distributions257 Questions
Exam 5: Continuous Random Variables and Probability Distributions239 Questions
Exam 6: Sampling and Sampling Distributions147 Questions
Exam 7: Estimation: Single Population151 Questions
Exam 8: Estimation: Additional Topics109 Questions
Exam 9: Hypothesis Testing: Single Population164 Questions
Exam 10: Hypothesis Testing: Additional Topics103 Questions
Exam 11: Simple Regression217 Questions
Exam 12: Multiple Regression252 Questions
Exam 13: Additional Topics in Regression Analysis168 Questions
Exam 14: Analysis of Categorical Data241 Questions
Exam 15: Analysis of Variance192 Questions
Exam 16: Time-Series Analysis and Forecasting138 Questions
Exam 17: Additional Topics in Sampling110 Questions
Select questions type
THE NEXT QUESTIONS ARE BASED ON THE FOLLOWING INFORMATION:
In a study of foreign holdings in Egyptian banks,the following sample regression results were obtained,based on 14 annual observations:  = -3.25 +
  -
-  +
+  ,and R2 = 0.92,
Where the numbers in parentheses under the coefficient estimates are the estimated coefficient standard errors,and
y = Year-end share of assets in Egyptian bank subsidiaries held by foreigners,as a percentage of total assets
x1 = Annual change,in billions of Egyptian pounds,in foreign direct investment in Egypt
x2 = Bank price-earnings ratio
x3 = Index of the exchange value of the Egyptian pounds
-Find a 95% confidence intervals for β3.
,and R2 = 0.92,
Where the numbers in parentheses under the coefficient estimates are the estimated coefficient standard errors,and
y = Year-end share of assets in Egyptian bank subsidiaries held by foreigners,as a percentage of total assets
x1 = Annual change,in billions of Egyptian pounds,in foreign direct investment in Egypt
x2 = Bank price-earnings ratio
x3 = Index of the exchange value of the Egyptian pounds
-Find a 95% confidence intervals for β3.
(Essay)
4.9/5  (42)
(42)
As you add irrelevant independent variables to a regression model,the coefficient of determination R2 will increase.
(True/False)
4.7/5 (35)
In a multiple regression model,there are two independent variables and 25 observations.If SSE = 0.0625 and SST = 0.475,what is the value of the adjusted coefficient of determination?
(Multiple Choice)
4.9/5 (39)
THE NEXT QUESTIONS ARE BASED ON THE FOLLOWING INFORMATION:
An estimated linear model is given by  = 12 - 3x1 - 4x2 + 7x3.
-When x3 decreases by 2,what is the change in
= 12 - 3x1 - 4x2 + 7x3.
-When x3 decreases by 2,what is the change in  ?
?
(Essay)
4.8/5 (30)
Multiple regression is a procedure for obtaining an equation that predicts a dependent or endogenous variable as a function of two or more independent or exogenous variables.
(True/False)
4.8/5 (37)
THE NEXT QUESTIONS ARE BASED ON THE FOLLOWING INFORMATION:
The computer output for the multiple regression model,y = β0 + β1X1 + β2X2 + ε is shown below.However,because of a printer malfunction some of the results are not shown.These are identified by asterisks.
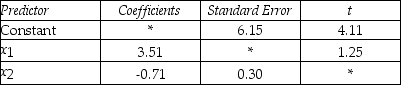 S = * R-Sq = *
ANALYSIS OF VARIANCE
S = * R-Sq = *
ANALYSIS OF VARIANCE
 -What is the test statistic for testing H0 : β2 = 0 against H1 : β2 ≠ 0?
(Essay)
4.8/5 (38)
THE NEXT QUESTIONS ARE BASED ON THE FOLLOWING INFORMATION:
The model y = β0 + β1X1 + β2X2 + ε was fitted to a sample of 25 families in order to explain household milk consumption: where y = Milk consumption,in quarts,per week,x1 = Weekly income,in hundreds of dollars,and x2 = Family size.The least squares estimates of the regression parameters were b0 = -0.03,b1 = 0.05,and b2 = 1.1,with coefficient standard errors  = 0.02;
  = 0.38.The total sum of squares and the error sum of squares were found to be 165.8 and 66.32 respectively.
-Test against the appropriate one-sided alternative,the null hypothesis that,for fixed family size,milk consumption does not depend linearly on income.Use α = 0.025.
= 0.38.The total sum of squares and the error sum of squares were found to be 165.8 and 66.32 respectively.
-Test against the appropriate one-sided alternative,the null hypothesis that,for fixed family size,milk consumption does not depend linearly on income.Use α = 0.025.
(Essay)
5.0/5 (38)
THE NEXT QUESTIONS ARE BASED ON THE FOLLOWING INFORMATION:
A production manager is interested in modeling the determinants of the average cost of production.He creates the following model: Y = β0 + β1X1 + β2X2 + β3
 + ε,where X1 is the cost per unit of the primary input,and X2 is the level of output.He examines the records over the past 45 production runs and obtains the following results:
 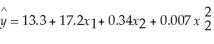 .
-What would the manager's null and alternative hypotheses for testing the significance of β2 be?
.
-What would the manager's null and alternative hypotheses for testing the significance of β2 be?
(Multiple Choice)
4.8/5 (28)
In a multiple regression problem involving two independent variables X1 and X2,what does it mean if b2 is computed to be -1.5?
(Multiple Choice)
4.8/5 (37)
THE NEXT QUESTIONS ARE BASED ON THE FOLLOWING INFORMATION:
A professor investigated some of the factors that affect an individual student's final grade in his course.He proposed the multiple regression model Y = β0 + β1X1 + β2X2 + β3X3 + ε ,where Y is the final mark (out of 100),X1 is the number of lectures skipped,X2 is the number of late assignments,and X3 is the mid-term test mark (out of 100).The professor recorded the data for 50 randomly selected students.The computer output is shown below.
The regression equation is  = 41.6 - 3.18x1 - 1.17x2 + 0.63x3.
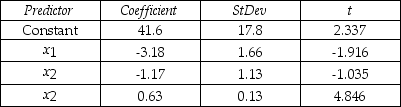 S = 13.74 R-Sq = 30.0%
ANALYSIS OF VARIANCE
S = 13.74 R-Sq = 30.0%
ANALYSIS OF VARIANCE
 -Does the data provide enough evidence to conclude that,at the 1% significance level,the final mark and the mid-term test mark show a positive linear relationship?
(Essay)
4.7/5 (30)
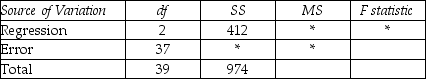
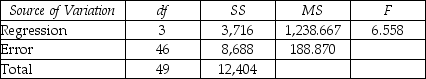
THE NEXT QUESTIONS ARE BASED ON THE FOLLOWING INFORMATION:
A regression analysis has produced the following partial analysis of variance table:
Analysis of Variance
 -Compute the adjusted coefficient of determination.
(Essay)
4.7/5 (35)
In a multiple regression with two independent variables X1 and X2,the multiple standard error of the estimate measures the variation of the dependent variable Y about a predicted regression plane.
(True/False)
4.7/5 (33)
THE NEXT QUESTIONS ARE BASED ON THE FOLLOWING INFORMATION:
In examining the determinants of income,data were collected regarding the characteristics of 45 adults,and the regression Y = β0 + β1X1 + β2X2 + β3X3 +ε was used,where Y is the annual income (in thousands of dollars),X1 is the person's age,X2 is his/her years of education,and X3 is a dummy variable = 1 if the adult is female.
-If you get  = 26.3 + 1.38x1 + 2.98x2 - 0.76x3 when you run the regression,how would you interpret the coefficient on gender?
(Multiple Choice)
4.8/5 (40)
In calculating the standard error of the estimate,se =  ,there are (n - K - 1)degrees of freedom,where n is the sample size and K is the number of independent variables in the model.
(True/False)
4.9/5 (28)
THE NEXT QUESTIONS ARE BASED ON THE FOLLOWING INFORMATION:
A professor investigated some of the factors that affect an individual student's final grade in his course.He proposed the multiple regression model Y = β0 + β1X1 + β2X2 + β3X3 + ε ,where Y is the final mark (out of 100),X1 is the number of lectures skipped,X2 is the number of late assignments,and X3 is the mid-term test mark (out of 100).The professor recorded the data for 50 randomly selected students.The computer output is shown below.
The regression equation is
= 41.6 - 3.18x1 - 1.17x2 + 0.63x3.
S = 13.74 R-Sq = 30.0%
ANALYSIS OF VARIANCE
-Does the data provide enough evidence to conclude that,at the 5% significance level,the final mark and the number of skipped lectures are linearly related?
(Essay)
4.8/5 (36)
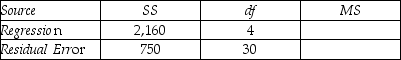
THE NEXT QUESTIONS ARE BASED ON THE FOLLOWING INFORMATION:
A regression analysis has produced the following partial analysis of variance table:
Analysis of Variance
-Compute  and se.
(Essay)
4.9/5 (32)
Filters
- Essay(0)
- Multiple Choice(0)
- Short Answer(0)
- True False(0)
- Matching(0)