Exam 12: Multiple Regression
Exam 1: Describing Data: Graphical247 Questions
Exam 2: Describing Data: Numerical326 Questions
Exam 3: Probability345 Questions
Exam 4: Discrete Random Variables and Probability Distributions257 Questions
Exam 5: Continuous Random Variables and Probability Distributions239 Questions
Exam 6: Sampling and Sampling Distributions147 Questions
Exam 7: Estimation: Single Population151 Questions
Exam 8: Estimation: Additional Topics109 Questions
Exam 9: Hypothesis Testing: Single Population164 Questions
Exam 10: Hypothesis Testing: Additional Topics103 Questions
Exam 11: Simple Regression217 Questions
Exam 12: Multiple Regression252 Questions
Exam 13: Additional Topics in Regression Analysis168 Questions
Exam 14: Analysis of Categorical Data241 Questions
Exam 15: Analysis of Variance192 Questions
Exam 16: Time-Series Analysis and Forecasting138 Questions
Exam 17: Additional Topics in Sampling110 Questions
Select questions type
In a regression model involving 50 observations,the following estimated regression model was obtained:  = 8.6 + 2.3x1 + 3.8x2 + 6.1x3.For this model,the following statistics are given: SSR = 360 and SSE = 129.The value of MSR is:
(Multiple Choice)
4.9/5  (35)
(35)
THE NEXT QUESTIONS ARE BASED ON THE FOLLOWING INFORMATION:
The model y = β0 + β1X1 + β2X2 + ε was fitted to a sample of 25 families in order to explain household milk consumption: where y = Milk consumption,in quarts,per week,x1 = Weekly income,in hundreds of dollars,and x2 = Family size.The least squares estimates of the regression parameters were b0 = -0.03,b1 = 0.05,and b2 = 1.1,with coefficient standard errors  = 0.02;
  = 0.38.The total sum of squares and the error sum of squares were found to be 165.8 and 66.32 respectively.
-Set up the analysis of variance table for testing H0 : β1 = β2 = 0 against H1 : At least one βj ≠ 0,(j = 1,2).
= 0.38.The total sum of squares and the error sum of squares were found to be 165.8 and 66.32 respectively.
-Set up the analysis of variance table for testing H0 : β1 = β2 = 0 against H1 : At least one βj ≠ 0,(j = 1,2).
(Essay)
4.9/5 (34)
THE NEXT QUESTIONS ARE BASED ON THE FOLLOWING INFORMATION:
An actuary wanted to develop a model to predict how long individuals will live.After consulting a number of physicians,she collected the age at death (y),the average number of hours of exercise per week (x1),the cholesterol level (x2),and the number of points that the individual's blood pressure exceeded the recommended value (x3).A random sample of 40 individuals was selected.The computer output of the multiple regression model is shown below.
THE REGRESSION EQUATION IS:  = 55.8 + 1.79x1 - 0.021x2 - 0.016x3
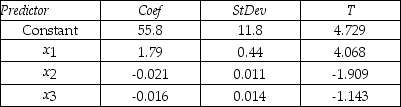 S = 9.47 R-Sq = 22.5%
ANALYSIS OF VARIANCE
S = 9.47 R-Sq = 22.5%
ANALYSIS OF VARIANCE
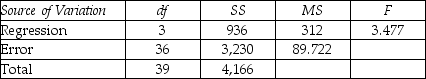 -Interpret the coefficient b3.
(Essay)
4.9/5 (40)
THE NEXT QUESTIONS ARE BASED ON THE FOLLOWING INFORMATION:
An actuary wanted to develop a model to predict how long individuals will live.After consulting a number of physicians,she collected the age at death (y),the average number of hours of exercise per week (x1),the cholesterol level (x2),and the number of points that the individual's blood pressure exceeded the recommended value (x3).A random sample of 40 individuals was selected.The computer output of the multiple regression model is shown below.
THE REGRESSION EQUATION IS:
= 55.8 + 1.79x1 - 0.021x2 - 0.016x3
S = 9.47 R-Sq = 22.5%
ANALYSIS OF VARIANCE
-Is there sufficient evidence at the 5% significance level to infer that the number of points that the individual's blood pressure exceeded the recommended value and the age at death show a negative linear relationship?
(Essay)
4.9/5 (35)
The confidence intervals and the hypothesis tests in multiple regression are not seriously affected by departures from normality in the distribution of the error terms.
(True/False)
4.8/5 (26)
THE NEXT QUESTIONS ARE BASED ON THE FOLLOWING INFORMATION:
A regression analysis has produced the following partial analysis of variance table:
Analysis of Variance
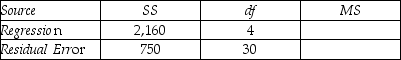 -Compute SST.
(Short Answer)
4.7/5 (31)
THE NEXT QUESTIONS ARE BASED ON THE FOLLOWING INFORMATION:
Suppose you are interested in determining the factors that influence the time required to prepare a tax return,and developed the model: Y = β0 + β1X1 + β2X2 + β3X3 + β4X4 + ε,where Y is the amount of time (in minutes),X1 is the income of the individual (in thousands of dollars),X2 is the age of the individual,X3 is the number of people living in the household,and X4 is a dummy variable that takes the value 1,if the individual owns his or her own home.After interviewing 40 accountants,you get the following results:  = 17.2 + 3.8x1 - 1.04x2 + 2.15x3 + 15.1x4,
  = 5.3,
  = 0.13,
  = 0.33,
  = 1.51,
  = 4.7,SSR = 164.2,SSE = 200.7,and R2 = 0.45.
-Test H0 : β4 = 0 against H1 : β4 ≠ 0 and interpret your result.
= 4.7,SSR = 164.2,SSE = 200.7,and R2 = 0.45.
-Test H0 : β4 = 0 against H1 : β4 ≠ 0 and interpret your result.
(Essay)
4.9/5 (30)
THE NEXT QUESTIONS ARE BASED ON THE FOLLOWING INFORMATION:
As director of the local tourist board,you are interested in determining the factors that influence the hotel occupancy rate in your city each month.Hotel occupancy can be measured as the percentage of available hotel rooms that are occupied by paying customers.You develop the following model: Y = β0 + β1X1 + β2X2 + β3X3 + β4X4 + ε,where Y is the hotel occupancy rate,X1 is the total number of passengers arriving at the airport,X2 is a price index of local hotel room rates,X3 is the consumer confidence index,and X4 is a dummy variable = 1 during the months of June,July,and August.You look at data from the past 36 months and obtain the following results:  = 67.1 + 0.02x1 - 0.055x2 + 0.08x3 + 12.3x4,R2 = 0.67,
  = 58.3,
  = 0.008,
  = 0.01,
  = 0.06,
  = 4.7,and SSE = 576.
-Test the hypothesis H0 : β1 = 0 and interpret your results.
= 4.7,and SSE = 576.
-Test the hypothesis H0 : β1 = 0 and interpret your results.
(Essay)
4.7/5 (29)
THE NEXT QUESTIONS ARE BASED ON THE FOLLOWING INFORMATION:
As director of the local tourist board,you are interested in determining the factors that influence the hotel occupancy rate in your city each month.Hotel occupancy can be measured as the percentage of available hotel rooms that are occupied by paying customers.You develop the following model: Y = β0 + β1X1 + β2X2 + β3X3 + β4X4 + ε,where Y is the hotel occupancy rate,X1 is the total number of passengers arriving at the airport,X2 is a price index of local hotel room rates,X3 is the consumer confidence index,and X4 is a dummy variable = 1 during the months of June,July,and August.You look at data from the past 36 months and obtain the following results:
= 67.1 + 0.02x1 - 0.055x2 + 0.08x3 + 12.3x4,R2 = 0.67,
= 58.3,
= 0.008,
= 0.01,
= 0.06,
= 4.7,and SSE = 576.
-What are your hypotheses regarding this model? Explain.Are there any other variables you would have liked to include?
(Essay)
4.8/5 (38)
How should the loan officer interpret the coefficient on x2?
(Multiple Choice)
4.9/5 (31)
How would we interpret the coefficient of determination R2?
(Multiple Choice)
4.8/5 (35)
Consider the F-test of overall significance.If we reject H0 : β1 = β2 = β3 = β4 = 0,what can you conclude?
(Multiple Choice)
4.9/5 (32)
In multiple regression analysis,to test H0 : β1 = β2 = ∙ ∙ ∙ ∙ ∙ ∙ = βk = 0,an F statistic with K and n - K - 1 degrees of freedom is used.
(True/False)
4.8/5 (31)
What is the most accurate conclusion regarding the hypothesis test for β3?
(Multiple Choice)
4.7/5 (41)
THE NEXT QUESTIONS ARE BASED ON THE FOLLOWING INFORMATION:
Suppose you are interested in determining the factors that influence the time required to prepare a tax return.You develop the model Y = β0 + β1X1 + β2X2 + β3
 + β4X3 + β5X4 + β6(X1 ∙ X4) + ε,where Y is the amount of time in minutes,X1 is the income of the individual (in thousands of dollars),X2 is the age of the individual,X3 is the number of people living in the household,and X4 is a dummy variable that takes the value 1 if the individual owns his or her own home.After interviewing 40 accountants,you obtained
  = 17.2 + 0.38x1 + 1.04x2 - 0.04
  + 2.15x3 + 0.11x4 - 0.22(x1 ∙ x4),
  = 5.3,
  = 0.13,
  = 0.33,
  = 1.51,
  = 4.7,
  = 0.05,and
  = 0.07.
-Test the hypothesis H0 : β3 = 0 and interpret your result.
= 0.07.
-Test the hypothesis H0 : β3 = 0 and interpret your result.
(Essay)
4.7/5 (31)
THE NEXT QUESTIONS ARE BASED ON THE FOLLOWING INFORMATION:
An estimated linear model is given by  = 12 - 3x1 - 4x2 + 7x3.
-When x2 decreases by 2,what is the change in
= 12 - 3x1 - 4x2 + 7x3.
-When x2 decreases by 2,what is the change in  ?
?
(Essay)
4.9/5 (38)
THE NEXT QUESTIONS ARE BASED ON THE FOLLOWING INFORMATION:
A loan officer is interested in examining the determinants of the total dollar value of residential loans made during a month.She used Y = β0 + β1X1 + β2X2 + β3X3 + β4X4 + ε to model the relationship,where Y is the total dollar value of residential loans in a month (in millions of dollars),X1 is the number of loans,X2 is the interest rate,X3 is the dollar value of expenditures of the bank on advertising (in thousands of dollars),and X4 is a dummy variable equal to 1 if the observation is either June,July,or August.
-Suppose that she obtained  = 3.8 + 0.23x1 - 1.31x2 + 0.032x3 + 1.05x4 - 0.22x3x4 by using data from the past 24 months.How would we interpret the coefficient of x3x4?
(Multiple Choice)
4.8/5 (31)
In multiple regression analysis,the mean square regression (MSR)is a measure of the explained variability adjusted for the number of independent variables.
(True/False)
4.9/5 (33)
As the sample size increases,we would expect a greater difference between R2 and  2.
2.
(True/False)
4.8/5 (34)
Filters
- Essay(0)
- Multiple Choice(0)
- Short Answer(0)
- True False(0)
- Matching(0)