Exam 12: Multiple Regression
Exam 1: Describing Data: Graphical247 Questions
Exam 2: Describing Data: Numerical326 Questions
Exam 3: Probability345 Questions
Exam 4: Discrete Random Variables and Probability Distributions257 Questions
Exam 5: Continuous Random Variables and Probability Distributions239 Questions
Exam 6: Sampling and Sampling Distributions147 Questions
Exam 7: Estimation: Single Population151 Questions
Exam 8: Estimation: Additional Topics109 Questions
Exam 9: Hypothesis Testing: Single Population164 Questions
Exam 10: Hypothesis Testing: Additional Topics103 Questions
Exam 11: Simple Regression217 Questions
Exam 12: Multiple Regression252 Questions
Exam 13: Additional Topics in Regression Analysis168 Questions
Exam 14: Analysis of Categorical Data241 Questions
Exam 15: Analysis of Variance192 Questions
Exam 16: Time-Series Analysis and Forecasting138 Questions
Exam 17: Additional Topics in Sampling110 Questions
Select questions type
THE NEXT QUESTIONS ARE BASED ON THE FOLLOWING INFORMATION:
Assume that x1 is a continuous variable and x2 is a dummy variable with a value of 0 or 1.
-What are the model constant and the slope coefficient of x1 when x2 equals 1 in the equation 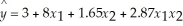 ?
?
(Essay)
4.9/5  (37)
(37)
The multiple coefficient of determination for a multiple regression model with two explanatory variables X1 and X2:
(Multiple Choice)
4.8/5 (36)
In reference to the multiple regression model  = 40 + 15x1 - 10x2 + 5x3,if x2 were to increase by five units,holding x1 and x3 constant,then the value of y would decrease on average by 50 units.
(True/False)
4.8/5 (32)
THE NEXT QUESTIONS ARE BASED ON THE FOLLOWING INFORMATION:
The model y = β0 + β1X1 + β2X2 + ε was fitted to a sample of 25 families in order to explain household milk consumption: where y = Milk consumption,in quarts,per week,x1 = Weekly income,in hundreds of dollars,and x2 = Family size.The least squares estimates of the regression parameters were b0 = -0.03,b1 = 0.05,and b2 = 1.1,with coefficient standard errors  = 0.02;
  = 0.38.The total sum of squares and the error sum of squares were found to be 165.8 and 66.32 respectively.
-Test the hypothesis H0 : β1 = β2 = 0 against H1 : At least one βj ≠ 0,(j = 1,2)at the 1% significance level.
= 0.38.The total sum of squares and the error sum of squares were found to be 165.8 and 66.32 respectively.
-Test the hypothesis H0 : β1 = β2 = 0 against H1 : At least one βj ≠ 0,(j = 1,2)at the 1% significance level.
(Essay)
4.9/5 (27)
THE NEXT QUESTIONS ARE BASED ON THE FOLLOWING INFORMATION:
The model y = β0 + β1X1 + β2X2 + ε was fitted to a sample of 25 families in order to explain household milk consumption: where y = Milk consumption,in quarts,per week,x1 = Weekly income,in hundreds of dollars,and x2 = Family size.The least squares estimates of the regression parameters were b0 = -0.03,b1 = 0.05,and b2 = 1.1,with coefficient standard errors
= 0.02;
= 0.38.The total sum of squares and the error sum of squares were found to be 165.8 and 66.32 respectively.
-Interpret the estimate b2.
(Essay)
4.8/5 (28)
THE NEXT QUESTIONS ARE BASED ON THE FOLLOWING INFORMATION:
An actuary wanted to develop a model to predict how long individuals will live.After consulting a number of physicians,she collected the age at death (y),the average number of hours of exercise per week (x1),the cholesterol level (x2),and the number of points that the individual's blood pressure exceeded the recommended value (x3).A random sample of 40 individuals was selected.The computer output of the multiple regression model is shown below.
THE REGRESSION EQUATION IS:  = 55.8 + 1.79x1 - 0.021x2 - 0.016x3
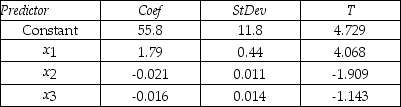 S = 9.47 R-Sq = 22.5%
ANALYSIS OF VARIANCE
S = 9.47 R-Sq = 22.5%
ANALYSIS OF VARIANCE
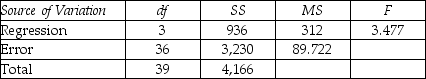 -Is there enough evidence at the 10% significance level to infer that the model is useful in predicting how long an individual will live?
(Essay)
4.9/5 (37)
THE NEXT QUESTIONS ARE BASED ON THE FOLLOWING INFORMATION:
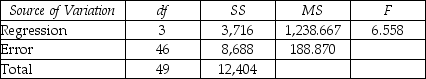
Consider the following regression model: Y = β0 + β1X1 + β2X2 + β3X3 + ε.Suppose that you have estimated the coefficients for the model,and obtained the partial ANOVA table shown below.
Analysis of Variance
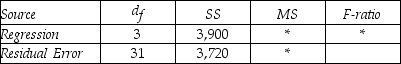 -Test the null hypothesis H0 : β1 = β2 = β3 = 0 against H1 : At least one βj ≠ 0,j = 1,2,3 at the 1% significance level.
(Essay)
4.7/5 (25)
THE NEXT QUESTIONS ARE BASED ON THE FOLLOWING INFORMATION:
The model y = β0 + β1X1 + β2X2 + ε was fitted to a sample of 25 families in order to explain household milk consumption: where y = Milk consumption,in quarts,per week,x1 = Weekly income,in hundreds of dollars,and x2 = Family size.The least squares estimates of the regression parameters were b0 = -0.03,b1 = 0.05,and b2 = 1.1,with coefficient standard errors
= 0.02;
= 0.38.The total sum of squares and the error sum of squares were found to be 165.8 and 66.32 respectively.
-Is it possible to provide a meaningful interpretation of the estimate b0?
(Essay)
4.9/5 (35)
Which of the following would you use to apply multiple regression to situations when independent variables are categorical?
(Multiple Choice)
4.8/5 (31)
THE NEXT QUESTIONS ARE BASED ON THE FOLLOWING INFORMATION:
A professor investigated some of the factors that affect an individual student's final grade in his course.He proposed the multiple regression model Y = β0 + β1X1 + β2X2 + β3X3 + ε ,where Y is the final mark (out of 100),X1 is the number of lectures skipped,X2 is the number of late assignments,and X3 is the mid-term test mark (out of 100).The professor recorded the data for 50 randomly selected students.The computer output is shown below.
The regression equation is  = 41.6 - 3.18x1 - 1.17x2 + 0.63x3.
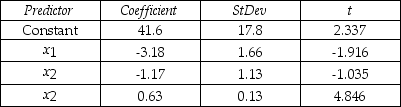 S = 13.74 R-Sq = 30.0%
ANALYSIS OF VARIANCE
S = 13.74 R-Sq = 30.0%
ANALYSIS OF VARIANCE
 -Does the data provide enough evidence to conclude that,at the 5% significance level,the final mark and the number of late assignments are negatively linearly related?
(Essay)
4.8/5 (28)
THE NEXT QUESTIONS ARE BASED ON THE FOLLOWING INFORMATION:
As director of the local tourist board,you are interested in determining the factors that influence the hotel occupancy rate in your city each month.Hotel occupancy can be measured as the percentage of available hotel rooms that are occupied by paying customers.You develop the following model: Y = β0 + β1X1 + β2X2 + β3X3 + β4X4 + ε,where Y is the hotel occupancy rate,X1 is the total number of passengers arriving at the airport,X2 is a price index of local hotel room rates,X3 is the consumer confidence index,and X4 is a dummy variable = 1 during the months of June,July,and August.You look at data from the past 36 months and obtain the following results:  = 67.1 + 0.02x1 - 0.055x2 + 0.08x3 + 12.3x4,R2 = 0.67,
  = 58.3,
  = 0.008,
  = 0.01,
  = 0.06,
  = 4.7,and SSE = 576.
-Test the hypothesis H0 : β1 = β2 = β3 = β4 = 0.Interpret your results.
= 4.7,and SSE = 576.
-Test the hypothesis H0 : β1 = β2 = β3 = β4 = 0.Interpret your results.
(Essay)
4.9/5 (42)
In multiple regression,if the confidence interval for a regression parameter βi includes 0,we cannot reject the two-sided hypothesis that this coefficient is 0.
(True/False)
4.8/5 (27)
By transforming the variables,we can estimate a linear multiple regression model and use the results as a nonlinear model.
(True/False)
4.8/5 (34)
The coefficient of multiple correlation R measures the strength of the relationship between the dependent variable and the independent variables.
(True/False)
4.7/5 (42)
THE NEXT QUESTIONS ARE BASED ON THE FOLLOWING INFORMATION:
As director of the local tourist board,you are interested in determining the factors that influence the hotel occupancy rate in your city each month.Hotel occupancy can be measured as the percentage of available hotel rooms that are occupied by paying customers.You develop the following model: Y = β0 + β1X1 + β2X2 + β3X3 + β4X4 + ε,where Y is the hotel occupancy rate,X1 is the total number of passengers arriving at the airport,X2 is a price index of local hotel room rates,X3 is the consumer confidence index,and X4 is a dummy variable = 1 during the months of June,July,and August.You look at data from the past 36 months and obtain the following results:
= 67.1 + 0.02x1 - 0.055x2 + 0.08x3 + 12.3x4,R2 = 0.67,
= 58.3,
= 0.008,
= 0.01,
= 0.06,
= 4.7,and SSE = 576.
-Interpret the estimated regression coefficient b2.
(Essay)
4.8/5 (37)
The least squares procedure for multiple regression computes the estimated coefficients so as to minimize the sum of the residuals.
(True/False)
4.9/5 (32)
Adding independent variables to the multiple regression model increases the value of the coefficient of determination.
(True/False)
4.8/5 (30)
A multiple regression model involves 5 independent variables and a sample of 10 data points.If we want to test the validity of the model at the 5% significance level,the critical value is:
(Multiple Choice)
4.9/5 (32)
Filters
- Essay(0)
- Multiple Choice(0)
- Short Answer(0)
- True False(0)
- Matching(0)