Exam 9: Aggregate Demand and Aggregate Supply Analysis
Exam 1: Economics: Foundations and Models148 Questions
Exam 2: Trade-Offs, Comparative Advantage, and the Market System314 Questions
Exam 3: Where Prices Come From: The Interaction of Supply and Demand314 Questions
Exam 4: GDP: Measuring Total Production and Income277 Questions
Exam 5: Unemployment and Inflation300 Questions
Exam 6: Economic Growth, The Financial System, and Business Cycles262 Questions
Exam 7: Long-Run Economic Growth: Sources and Policies280 Questions
Exam 8: Aggregate Expenditure and Output in the Short Run315 Questions
Exam 9: Aggregate Demand and Aggregate Supply Analysis246 Questions
Exam 10: Money, Banks, and the Bank of Canada285 Questions
Exam 11: Monetary Policy281 Questions
Exam 12: Fiscal Policy303 Questions
Exam 13: Inflation, Unemployment, and Bank of Canada Policy265 Questions
Exam 14: Macroeconomics in an Open Economy280 Questions
Exam 15: The International Financial System228 Questions
Select questions type
After an unexpected ________ in the price of oil, the long-run adjustment decreases the price level and ________ the unemployment rate as they return to their original levels.
(Multiple Choice)
4.7/5  (34)
(34)
Which of the following is one explanation as to why the aggregate demand curve slopes downward?
(Multiple Choice)
4.9/5 (30)
A decrease in aggregate demand results in a(n)________ in the ________.
(Multiple Choice)
4.8/5 (34)
Using the aggregate supply and demand model, illustrate what happens in the long run when the economy suffers a supply shock.Begin your analysis by assuming the economy has suffered the supply shock in the short run, but has not yet adjusted to it in the long run.
(Essay)
4.7/5 (30)
Figure 9.5 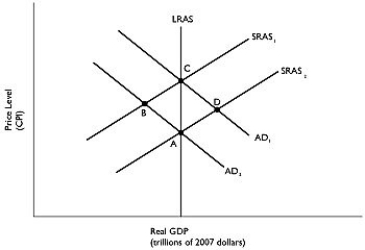 Alt text for Figure 9.5: In figure 9.5, a graph comparing real GDP and price level.
Long description for Figure 9.5: The x-axis is labelled, real GDP (trillions of 2007 dollars), and the y-axis is labelled, price level (CPI).5 lines are shown; SRAS1, SRAS2, AD1, AD2, and LRAS.Line SRAS1 begins above the vertex and slopes up to the top right corner.Line SRAS2 follows the same slope as line SRAS1, but is plotted to the right.Line AD1 begins at the top left corner and slopes down to the bottom center.Line AD2 follows the same slope as AD1, but is plotted to the right.Line SRAS1 intersects line AD1 at point C, more than half way along both the lines.Line SRAS1 intersects line AD2 at point B, approximately 3 quarters of the way along both lines.Line SRAS2 intersects line AD1 at point D, approximately 3 quarters of the way along both lines.Line SRAS2 intersects line AD2 at point A, more than half way along both lines.Line LRAS is perpendicular to the x-axis, passing through the points A and C, and intersecting all the 4 lines.
-Refer to Figure 9.5.Suppose the economy is at point A.If consumer spending increases in the economy, where will the eventual long-run equilibrium be?
Alt text for Figure 9.5: In figure 9.5, a graph comparing real GDP and price level.
Long description for Figure 9.5: The x-axis is labelled, real GDP (trillions of 2007 dollars), and the y-axis is labelled, price level (CPI).5 lines are shown; SRAS1, SRAS2, AD1, AD2, and LRAS.Line SRAS1 begins above the vertex and slopes up to the top right corner.Line SRAS2 follows the same slope as line SRAS1, but is plotted to the right.Line AD1 begins at the top left corner and slopes down to the bottom center.Line AD2 follows the same slope as AD1, but is plotted to the right.Line SRAS1 intersects line AD1 at point C, more than half way along both the lines.Line SRAS1 intersects line AD2 at point B, approximately 3 quarters of the way along both lines.Line SRAS2 intersects line AD1 at point D, approximately 3 quarters of the way along both lines.Line SRAS2 intersects line AD2 at point A, more than half way along both lines.Line LRAS is perpendicular to the x-axis, passing through the points A and C, and intersecting all the 4 lines.
-Refer to Figure 9.5.Suppose the economy is at point A.If consumer spending increases in the economy, where will the eventual long-run equilibrium be?
(Multiple Choice)
4.8/5 (28)
Which of the following could explain why there is an increase in potential GDP but the equilibrium level of GDP does not rise?
(Multiple Choice)
4.9/5 (32)
Figure 9.6 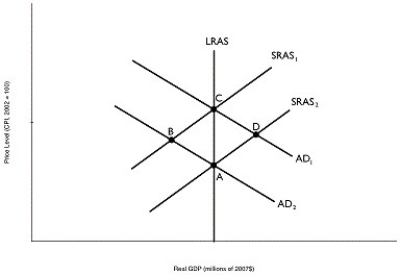 Alt text for Figure 9.6: In figure 9.6, a graph depicting short-run equilibrium and long-run equilibrium.
Long description for Figure 9.6: The x-axis is labelled, real GDP (trillions of 2007 dollars), and the y-axis is labelled, price level (CPI).5 lines are shown; SRAS1, SRAS2, AD1, AD2, and LRAS.Line SRAS1 begins near the bottom left and slopes up to the top right corner.Line SRAS2 follows the same slope as line SRAS1, but is plotted to the right.Line AD1 begins at the top left corner and slopes down to the bottom center.Line AD2 follows the same slope as AD1, but is plotted to the right.Line SRAS1 intersects line AD1 at point C, more than half way along both lines.Line SRAS1 intersects line AD2 at point B, approximately 3 quarters of the way along both lines.Line SRAS2 intersects line AD1 at point D, approximately 3 quarters of the way along both lines.Line SRAS2 intersects the line AD2 at point A, more than half way along both lines.Line LRAS is perpendicular to the x-axis, passing through points A and C and intersecting all 4 lines.
-Refer to Figure 9.6.Suppose the economy is at point A.If government spending increases in the economy, where will the eventual long-run equilibrium be?
Alt text for Figure 9.6: In figure 9.6, a graph depicting short-run equilibrium and long-run equilibrium.
Long description for Figure 9.6: The x-axis is labelled, real GDP (trillions of 2007 dollars), and the y-axis is labelled, price level (CPI).5 lines are shown; SRAS1, SRAS2, AD1, AD2, and LRAS.Line SRAS1 begins near the bottom left and slopes up to the top right corner.Line SRAS2 follows the same slope as line SRAS1, but is plotted to the right.Line AD1 begins at the top left corner and slopes down to the bottom center.Line AD2 follows the same slope as AD1, but is plotted to the right.Line SRAS1 intersects line AD1 at point C, more than half way along both lines.Line SRAS1 intersects line AD2 at point B, approximately 3 quarters of the way along both lines.Line SRAS2 intersects line AD1 at point D, approximately 3 quarters of the way along both lines.Line SRAS2 intersects the line AD2 at point A, more than half way along both lines.Line LRAS is perpendicular to the x-axis, passing through points A and C and intersecting all 4 lines.
-Refer to Figure 9.6.Suppose the economy is at point A.If government spending increases in the economy, where will the eventual long-run equilibrium be?
(Multiple Choice)
4.9/5 (38)
Figure 9.6 Alt text for Figure 9.6: In figure 9.6, a graph depicting short-run equilibrium and long-run equilibrium.
Long description for Figure 9.6: The x-axis is labelled, real GDP (trillions of 2007 dollars), and the y-axis is labelled, price level (CPI).5 lines are shown; SRAS1, SRAS2, AD1, AD2, and LRAS.Line SRAS1 begins near the bottom left and slopes up to the top right corner.Line SRAS2 follows the same slope as line SRAS1, but is plotted to the right.Line AD1 begins at the top left corner and slopes down to the bottom center.Line AD2 follows the same slope as AD1, but is plotted to the right.Line SRAS1 intersects line AD1 at point C, more than half way along both lines.Line SRAS1 intersects line AD2 at point B, approximately 3 quarters of the way along both lines.Line SRAS2 intersects line AD1 at point D, approximately 3 quarters of the way along both lines.Line SRAS2 intersects the line AD2 at point A, more than half way along both lines.Line LRAS is perpendicular to the x-axis, passing through points A and C and intersecting all 4 lines.
-Refer to Figure 9.6.Which of the points in the above graph are possible short-run equilibria?
(Multiple Choice)
4.7/5 (36)
The automatic mechanism ________ the price level in the case of ________ and ________ the price level in the case of ________.
(Multiple Choice)
4.9/5 (35)
Figure 9.5 Alt text for Figure 9.5: In figure 9.5, a graph comparing real GDP and price level.
Long description for Figure 9.5: The x-axis is labelled, real GDP (trillions of 2007 dollars), and the y-axis is labelled, price level (CPI).5 lines are shown; SRAS1, SRAS2, AD1, AD2, and LRAS.Line SRAS1 begins above the vertex and slopes up to the top right corner.Line SRAS2 follows the same slope as line SRAS1, but is plotted to the right.Line AD1 begins at the top left corner and slopes down to the bottom center.Line AD2 follows the same slope as AD1, but is plotted to the right.Line SRAS1 intersects line AD1 at point C, more than half way along both the lines.Line SRAS1 intersects line AD2 at point B, approximately 3 quarters of the way along both lines.Line SRAS2 intersects line AD1 at point D, approximately 3 quarters of the way along both lines.Line SRAS2 intersects line AD2 at point A, more than half way along both lines.Line LRAS is perpendicular to the x-axis, passing through the points A and C, and intersecting all the 4 lines.
-Refer to Figure 9.5.Which of the points in the above graph are possible long-run equilibria?
(Multiple Choice)
4.8/5 (35)
If you noticed that fashion models were wearing longer skirts, the local store was sold out of lipstick, and skinny ties were all you saw for sale, it might be reasonable to assume
(Multiple Choice)
4.9/5 (36)
The basic aggregate demand and aggregate supply curve model helps explain ________ fluctuations in real GDP and the price level.
(Multiple Choice)
4.7/5 (38)
Because of the slope(s)of the ________, we can say that a decrease in the price level leads to a higher level of real GDP demanded.
(Multiple Choice)
4.8/5 (36)
Canada followed the U.S.into recession in 2008, but not in 2001.One important reason why Canada did not follow the U.S.into recession in 2001 is
(Multiple Choice)
4.8/5 (35)
Explain how the economy moves back to full employment from recession.Be sure to detail what happens to short-run aggregate supply, unemployment, equilibrium GDP and the price level.
(Essay)
4.9/5 (42)
Explain how each of the following events would affect the short-run aggregate supply curve.
a.a decrease in the price level
b.a decrease in what the price level is expected to be in the future
c.a price level that is currently lower than expected
d.an unexpected decrease in the price of an important raw material
e.a decrease in the labour force
(Essay)
4.7/5 (25)
Stagflation occurs when aggregate supply and aggregate demand both increase.
(True/False)
4.9/5 (37)
The winter of 2015 saw ridiculous levels of snowfall in the Maritimes and parts of eastern Canada.As a result, there were unexpected closures of business and government offices.Suppose that this caused an increase in the price level and a decline in real GDP in 2015.Also assume that potential real GDP continued to grow due to other factors.You can assume the aggregate demand curve did not change. Show the macroeconomic equilibrium for 2014 and 2015 using the dynamic aggregate supply and aggregate demand model.
(Essay)
4.9/5 (33)
Filters
- Essay(0)
- Multiple Choice(0)
- Short Answer(0)
- True False(0)
- Matching(0)