Exam 9: Aggregate Demand and Aggregate Supply Analysis
Exam 1: Economics: Foundations and Models148 Questions
Exam 2: Trade-Offs, Comparative Advantage, and the Market System314 Questions
Exam 3: Where Prices Come From: The Interaction of Supply and Demand314 Questions
Exam 4: GDP: Measuring Total Production and Income277 Questions
Exam 5: Unemployment and Inflation300 Questions
Exam 6: Economic Growth, The Financial System, and Business Cycles262 Questions
Exam 7: Long-Run Economic Growth: Sources and Policies280 Questions
Exam 8: Aggregate Expenditure and Output in the Short Run315 Questions
Exam 9: Aggregate Demand and Aggregate Supply Analysis246 Questions
Exam 10: Money, Banks, and the Bank of Canada285 Questions
Exam 11: Monetary Policy281 Questions
Exam 12: Fiscal Policy303 Questions
Exam 13: Inflation, Unemployment, and Bank of Canada Policy265 Questions
Exam 14: Macroeconomics in an Open Economy280 Questions
Exam 15: The International Financial System228 Questions
Select questions type
Explain the three reasons the aggregate demand curve slopes downward.
(Essay)
4.9/5  (31)
(31)
Ceteris paribus, in the long run, a negative supply shock causes
(Multiple Choice)
4.9/5 (38)
Which of the following could explain why there is an increase in potential GDP but the equilibrium level of GDP falls?
(Multiple Choice)
4.9/5 (35)
The mini recession that Canada experienced at the beginning of 2015 was most likely caused by
(Multiple Choice)
4.8/5 (41)
When the price level in Canada falls relative to the price level of other countries, ________ will fall, ________ will rise, and ________ will rise.
(Multiple Choice)
4.9/5 (32)
Which of the following is one reason for the decline in aggregate demand that led to the recession of 2008-2009?
(Multiple Choice)
4.9/5 (32)
Interest rates in the economy have risen.How will this affect aggregate demand and equilibrium in the short run?
(Multiple Choice)
4.7/5 (37)
Using aggregate demand and aggregate supply, explain what happens in the short run if the Bank of Canada raises interest rates in the economy.Be sure to detail what happens to aggregate demand, the price level, the level of GDP, and unemployment.Assume that the economy is at full employment before the interest rate increase.
(Essay)
4.7/5 (42)
In the dynamic aggregated demand and aggregate supply model, if AD shifts faster than AS,
(Multiple Choice)
4.9/5 (39)
An increase in investment causes the price level to ________ in the short run and ________ in the long run.
(Multiple Choice)
4.9/5 (29)
Figure 9.1 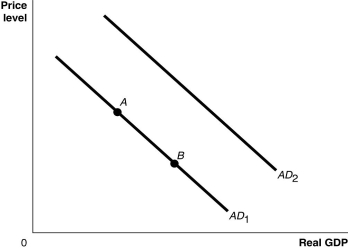 Alt text for Figure 9.1: In figure 9.1, a graph comparing real GDP and price level.
Long description for Figure 9.1: The x-axis is labelled, real GDP, and the y-axis is labelled, price level, with 0 at the vertex.Line AD1 begins in the top left corner and slopes down to the bottom center.Line AD2 follows the same slope as line AD1 but is plotted to the right.Points A and B are plotted along line AD1.Point A is a little less than half way along the left side of the line, and point B is little more than half way on the right side of the line.
-Refer to Figure 9.1.Ceteris paribus, a decrease in firms' expectations of the future profitability of investment spending would be represented by a movement from
Alt text for Figure 9.1: In figure 9.1, a graph comparing real GDP and price level.
Long description for Figure 9.1: The x-axis is labelled, real GDP, and the y-axis is labelled, price level, with 0 at the vertex.Line AD1 begins in the top left corner and slopes down to the bottom center.Line AD2 follows the same slope as line AD1 but is plotted to the right.Points A and B are plotted along line AD1.Point A is a little less than half way along the left side of the line, and point B is little more than half way on the right side of the line.
-Refer to Figure 9.1.Ceteris paribus, a decrease in firms' expectations of the future profitability of investment spending would be represented by a movement from
(Multiple Choice)
4.9/5 (31)
Suppose Canadian GDP growth rate is faster relative to other countries' GDP growth rates.This will
(Multiple Choice)
4.8/5 (31)
Figure 9.7 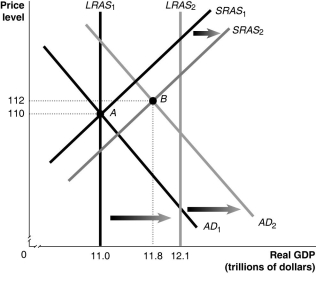 Alt text for Figure 9.7: In figure 9.7, a graph comparing real GDP and price level.
Long description for Figure 9.7: The x-axis is labelled, real GDP (trillions of dollars), with values 11.0, 11.8, 12.1 marked.The y-axis is labelled, price level, with values 110 and 112 marked.6 lines are shown; SRAS1, SRAS2, AD1, AD2, LRAS1, LRAS2.Line SRAS1 begins near the bottom left and slopes up to the top right corner.Line SRAS2 follows the same slope as line SRAS1, but is plotted to the right.The area between lines SRAS1 and SRAS2 is indicated by a right pointing arrow.Line AD1 begins at the top left corner and slopes down toward the bottom center.Line AD2 follows the same slope as AD1, but is plotted to the right.The area between lines AD1 and AD2 is indicated by a right pointing arrow.Line LRAS1 is perpendicular to the x-axis, and begins from value 11.0.Line LRAS2 perpendicular to the x-axis, and begins from point 12.1.The area between lines LRAS1 and LRAS2 is indicated by a right pointing arrow.Line LRAS1 intersects lines AD1 and SRAS1 at point A (11.0, 110).Lines AD2 and SRAS2 intersect at point B (11.8, 112).Points A and B are connected to their respective coordinates on the x-axis and y-axis with dotted lines.Line LRAS2 intersects lines SRAS1 and SRAS2 on the right end of these lines.Similarly, line LRAS2 intersects lines AD1 and AD2 on the right end of these lines.
-Refer to Figure 9.7.In the figure above, LRAS1 and SRAS1 denote LRAS and SRAS in year 1, while LRAS2 and SRAS2 denote LRAS and SRAS in year 2.Given the economy is at point A in year 1, what is the growth rate in potential GDP in year 2?
Alt text for Figure 9.7: In figure 9.7, a graph comparing real GDP and price level.
Long description for Figure 9.7: The x-axis is labelled, real GDP (trillions of dollars), with values 11.0, 11.8, 12.1 marked.The y-axis is labelled, price level, with values 110 and 112 marked.6 lines are shown; SRAS1, SRAS2, AD1, AD2, LRAS1, LRAS2.Line SRAS1 begins near the bottom left and slopes up to the top right corner.Line SRAS2 follows the same slope as line SRAS1, but is plotted to the right.The area between lines SRAS1 and SRAS2 is indicated by a right pointing arrow.Line AD1 begins at the top left corner and slopes down toward the bottom center.Line AD2 follows the same slope as AD1, but is plotted to the right.The area between lines AD1 and AD2 is indicated by a right pointing arrow.Line LRAS1 is perpendicular to the x-axis, and begins from value 11.0.Line LRAS2 perpendicular to the x-axis, and begins from point 12.1.The area between lines LRAS1 and LRAS2 is indicated by a right pointing arrow.Line LRAS1 intersects lines AD1 and SRAS1 at point A (11.0, 110).Lines AD2 and SRAS2 intersect at point B (11.8, 112).Points A and B are connected to their respective coordinates on the x-axis and y-axis with dotted lines.Line LRAS2 intersects lines SRAS1 and SRAS2 on the right end of these lines.Similarly, line LRAS2 intersects lines AD1 and AD2 on the right end of these lines.
-Refer to Figure 9.7.In the figure above, LRAS1 and SRAS1 denote LRAS and SRAS in year 1, while LRAS2 and SRAS2 denote LRAS and SRAS in year 2.Given the economy is at point A in year 1, what is the growth rate in potential GDP in year 2?
(Multiple Choice)
4.8/5 (36)
Which of the following is one explanation as to why the aggregate demand curve slopes downward?
(Multiple Choice)
4.8/5 (49)
What is a supply shock, and why might a supply shock lead to stagflation?
(Essay)
4.9/5 (42)
When the price of oil falls unexpectedly, the equilibrium price level ________ and the unemployment rate ________ in the short run.
(Multiple Choice)
4.8/5 (43)
Filters
- Essay(0)
- Multiple Choice(0)
- Short Answer(0)
- True False(0)
- Matching(0)