Exam 9: Aggregate Demand and Aggregate Supply Analysis
Exam 1: Economics: Foundations and Models148 Questions
Exam 2: Trade-Offs, Comparative Advantage, and the Market System314 Questions
Exam 3: Where Prices Come From: The Interaction of Supply and Demand314 Questions
Exam 4: GDP: Measuring Total Production and Income277 Questions
Exam 5: Unemployment and Inflation300 Questions
Exam 6: Economic Growth, The Financial System, and Business Cycles262 Questions
Exam 7: Long-Run Economic Growth: Sources and Policies280 Questions
Exam 8: Aggregate Expenditure and Output in the Short Run315 Questions
Exam 9: Aggregate Demand and Aggregate Supply Analysis246 Questions
Exam 10: Money, Banks, and the Bank of Canada285 Questions
Exam 11: Monetary Policy281 Questions
Exam 12: Fiscal Policy303 Questions
Exam 13: Inflation, Unemployment, and Bank of Canada Policy265 Questions
Exam 14: Macroeconomics in an Open Economy280 Questions
Exam 15: The International Financial System228 Questions
Select questions type
When the price level in Canada rises relative to the price level of other countries, ________ will rise, ________ will fall, and ________ will fall.
(Multiple Choice)
4.8/5  (35)
(35)
Suppose the economy is at a short-run equilibrium GDP that lies above potential GDP.Which of the following will occur because of the automatic mechanism adjusting the economy back to potential GDP?
(Multiple Choice)
4.9/5 (35)
Stagflation occurs when inflation ________ and GDP ________.
(Multiple Choice)
4.8/5 (33)
Assume interest rates in the economy have fallen.How will this affect aggregate demand and equilibrium in the short run?
(Multiple Choice)
4.8/5 (44)
The long-run adjustment to a negative supply shock results in
(Multiple Choice)
4.8/5 (35)
Figure 9.3 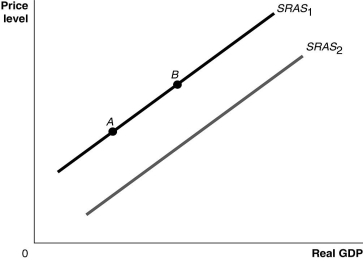 Alt text for Figure 9.3: In figure 9.3, a graph comparing real GDP and price level.
Long description for Figure 9.3: The x-axis is labelled, real GDP, with 0 at the vertex, and the y-axis is labelled, price level.2 lines are shown; SRAS1 and SRAS2.Line SRAS1 begins a little above the vertex and slopes up to the top right corner.Line SRAS2 follows the same slope as line SRAS1, but is plotted to the right.Points A and B are plotted on line SRAS1.Point A is near the left end of the line and point B is near the center of the line.
-Refer to Figure 9.3.Ceteris paribus, an increase in productivity would be represented by a movement from
Alt text for Figure 9.3: In figure 9.3, a graph comparing real GDP and price level.
Long description for Figure 9.3: The x-axis is labelled, real GDP, with 0 at the vertex, and the y-axis is labelled, price level.2 lines are shown; SRAS1 and SRAS2.Line SRAS1 begins a little above the vertex and slopes up to the top right corner.Line SRAS2 follows the same slope as line SRAS1, but is plotted to the right.Points A and B are plotted on line SRAS1.Point A is near the left end of the line and point B is near the center of the line.
-Refer to Figure 9.3.Ceteris paribus, an increase in productivity would be represented by a movement from
(Multiple Choice)
4.7/5 (41)
Filters
- Essay(0)
- Multiple Choice(0)
- Short Answer(0)
- True False(0)
- Matching(0)