Exam 9: Aggregate Demand and Aggregate Supply Analysis
Exam 1: Economics: Foundations and Models148 Questions
Exam 2: Trade-Offs, Comparative Advantage, and the Market System314 Questions
Exam 3: Where Prices Come From: The Interaction of Supply and Demand314 Questions
Exam 4: GDP: Measuring Total Production and Income277 Questions
Exam 5: Unemployment and Inflation300 Questions
Exam 6: Economic Growth, The Financial System, and Business Cycles262 Questions
Exam 7: Long-Run Economic Growth: Sources and Policies280 Questions
Exam 8: Aggregate Expenditure and Output in the Short Run315 Questions
Exam 9: Aggregate Demand and Aggregate Supply Analysis246 Questions
Exam 10: Money, Banks, and the Bank of Canada285 Questions
Exam 11: Monetary Policy281 Questions
Exam 12: Fiscal Policy303 Questions
Exam 13: Inflation, Unemployment, and Bank of Canada Policy265 Questions
Exam 14: Macroeconomics in an Open Economy280 Questions
Exam 15: The International Financial System228 Questions
Select questions type
Canada suffered a mini recession in the first half of 2015 due to
(Multiple Choice)
4.8/5  (37)
(37)
The dynamic aggregate demand and aggregate supply model assumes that potential GDP is constant across time.
(True/False)
4.8/5 (26)
Economists and industry analysts pay close attention to the volume of rail cargo shipments because changes in rail shipments have historically been good indicators of
(Multiple Choice)
4.9/5 (36)
Figure 9.5 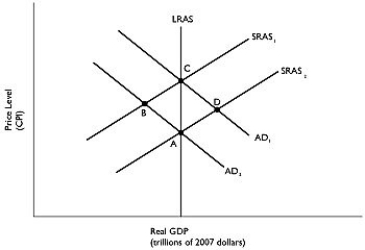 Alt text for Figure 9.5: In figure 9.5, a graph comparing real GDP and price level.
Long description for Figure 9.5: The x-axis is labelled, real GDP (trillions of 2007 dollars), and the y-axis is labelled, price level (CPI).5 lines are shown; SRAS1, SRAS2, AD1, AD2, and LRAS.Line SRAS1 begins above the vertex and slopes up to the top right corner.Line SRAS2 follows the same slope as line SRAS1, but is plotted to the right.Line AD1 begins at the top left corner and slopes down to the bottom center.Line AD2 follows the same slope as AD1, but is plotted to the right.Line SRAS1 intersects line AD1 at point C, more than half way along both the lines.Line SRAS1 intersects line AD2 at point B, approximately 3 quarters of the way along both lines.Line SRAS2 intersects line AD1 at point D, approximately 3 quarters of the way along both lines.Line SRAS2 intersects line AD2 at point A, more than half way along both lines.Line LRAS is perpendicular to the x-axis, passing through the points A and C, and intersecting all the 4 lines.
-Refer to Figure 9.5.Which of the points in the above graph are possible short-run equilibria but not long-run equilibria? Assume that Y1 represents potential GDP.
Alt text for Figure 9.5: In figure 9.5, a graph comparing real GDP and price level.
Long description for Figure 9.5: The x-axis is labelled, real GDP (trillions of 2007 dollars), and the y-axis is labelled, price level (CPI).5 lines are shown; SRAS1, SRAS2, AD1, AD2, and LRAS.Line SRAS1 begins above the vertex and slopes up to the top right corner.Line SRAS2 follows the same slope as line SRAS1, but is plotted to the right.Line AD1 begins at the top left corner and slopes down to the bottom center.Line AD2 follows the same slope as AD1, but is plotted to the right.Line SRAS1 intersects line AD1 at point C, more than half way along both the lines.Line SRAS1 intersects line AD2 at point B, approximately 3 quarters of the way along both lines.Line SRAS2 intersects line AD1 at point D, approximately 3 quarters of the way along both lines.Line SRAS2 intersects line AD2 at point A, more than half way along both lines.Line LRAS is perpendicular to the x-axis, passing through the points A and C, and intersecting all the 4 lines.
-Refer to Figure 9.5.Which of the points in the above graph are possible short-run equilibria but not long-run equilibria? Assume that Y1 represents potential GDP.
(Multiple Choice)
4.9/5 (43)
Which of the following would cause the short-run aggregate supply curve to shift to the right?
(Multiple Choice)
4.8/5 (29)
Figure 9.5 Alt text for Figure 9.5: In figure 9.5, a graph comparing real GDP and price level.
Long description for Figure 9.5: The x-axis is labelled, real GDP (trillions of 2007 dollars), and the y-axis is labelled, price level (CPI).5 lines are shown; SRAS1, SRAS2, AD1, AD2, and LRAS.Line SRAS1 begins above the vertex and slopes up to the top right corner.Line SRAS2 follows the same slope as line SRAS1, but is plotted to the right.Line AD1 begins at the top left corner and slopes down to the bottom center.Line AD2 follows the same slope as AD1, but is plotted to the right.Line SRAS1 intersects line AD1 at point C, more than half way along both the lines.Line SRAS1 intersects line AD2 at point B, approximately 3 quarters of the way along both lines.Line SRAS2 intersects line AD1 at point D, approximately 3 quarters of the way along both lines.Line SRAS2 intersects line AD2 at point A, more than half way along both lines.Line LRAS is perpendicular to the x-axis, passing through the points A and C, and intersecting all the 4 lines.
-Refer to Figure 9.5.Suppose the economy is at point C.If government spending decreases in the economy, where will the eventual long-run equilibrium be?
(Multiple Choice)
4.9/5 (42)
An increase in aggregate demand results in a(n)________ in the ________.
(Multiple Choice)
4.9/5 (44)
When the aggregate demand curve and the short-run aggregate supply curve intersect,
(Multiple Choice)
4.9/5 (34)
Explain whether Canadian National Railway's sales are likely to fluctuate more or less than the sales of each of the following firms as the economy moves from recession to expansion and back to recession.
-Whirlpool Corporation (appliance manufacturer)
-Taco Bell
-Bombardier (aircraft manufacturer)
-EB Games (video game sales)
(Essay)
4.9/5 (41)
The basic aggregate demand and aggregate supply curve model helps explain
(Multiple Choice)
5.0/5 (36)
Workers expect inflation to rise from 3% to 5% next year.As a result, this should
(Multiple Choice)
4.8/5 (42)
When the price level falls from 135 to 120, the aggregate level of GDP supplied falls from $140 billion to $125 billion.This ________ relationship represents the ________ relationship between GDP and the price level.
(Multiple Choice)
4.8/5 (33)
At a long-run macroeconomic equilibrium, real GDP is always equal to potential GDP.
(True/False)
4.9/5 (30)
Which of the following best describes the "interest rate effect"?
(Multiple Choice)
4.8/5 (36)
If the Canadian dollar decreases in value relative to other currencies, how does this affect the aggregate demand curve?
(Multiple Choice)
4.9/5 (33)
Suppose a developing country receives more machinery and capital equipment as foreign entrepreneurs increase the amount of investment in the economy.As a result
(Multiple Choice)
4.8/5 (39)
Filters
- Essay(0)
- Multiple Choice(0)
- Short Answer(0)
- True False(0)
- Matching(0)