Exam 9: Aggregate Demand and Aggregate Supply Analysis
Exam 1: Economics: Foundations and Models148 Questions
Exam 2: Trade-Offs, Comparative Advantage, and the Market System314 Questions
Exam 3: Where Prices Come From: The Interaction of Supply and Demand314 Questions
Exam 4: GDP: Measuring Total Production and Income277 Questions
Exam 5: Unemployment and Inflation300 Questions
Exam 6: Economic Growth, The Financial System, and Business Cycles262 Questions
Exam 7: Long-Run Economic Growth: Sources and Policies280 Questions
Exam 8: Aggregate Expenditure and Output in the Short Run315 Questions
Exam 9: Aggregate Demand and Aggregate Supply Analysis246 Questions
Exam 10: Money, Banks, and the Bank of Canada285 Questions
Exam 11: Monetary Policy281 Questions
Exam 12: Fiscal Policy303 Questions
Exam 13: Inflation, Unemployment, and Bank of Canada Policy265 Questions
Exam 14: Macroeconomics in an Open Economy280 Questions
Exam 15: The International Financial System228 Questions
Select questions type
Starting from long-run equilibrium, use the basic aggregate demand and aggregate supply diagram to show what happens in both the long run and the short run when there is a decline in wealth.
(Essay)
4.9/5  (31)
(31)
Figure 9.3 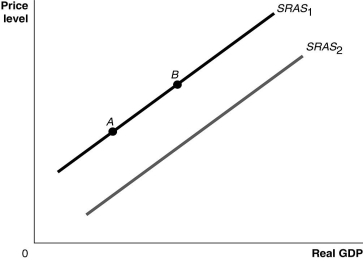 Alt text for Figure 9.3: In figure 9.3, a graph comparing real GDP and price level.
Long description for Figure 9.3: The x-axis is labelled, real GDP, with 0 at the vertex, and the y-axis is labelled, price level.2 lines are shown; SRAS1 and SRAS2.Line SRAS1 begins a little above the vertex and slopes up to the top right corner.Line SRAS2 follows the same slope as line SRAS1, but is plotted to the right.Points A and B are plotted on line SRAS1.Point A is near the left end of the line and point B is near the center of the line.
-Refer to Figure 9.3.Ceteris paribus, an increase in the expected future price level would be represented by a movement from
Alt text for Figure 9.3: In figure 9.3, a graph comparing real GDP and price level.
Long description for Figure 9.3: The x-axis is labelled, real GDP, with 0 at the vertex, and the y-axis is labelled, price level.2 lines are shown; SRAS1 and SRAS2.Line SRAS1 begins a little above the vertex and slopes up to the top right corner.Line SRAS2 follows the same slope as line SRAS1, but is plotted to the right.Points A and B are plotted on line SRAS1.Point A is near the left end of the line and point B is near the center of the line.
-Refer to Figure 9.3.Ceteris paribus, an increase in the expected future price level would be represented by a movement from
(Multiple Choice)
4.8/5 (33)
Why are the long-run effects of an increase in aggregate demand on price and output different from the short-run effects?
(Essay)
4.9/5 (31)
An increase in the price level shifts the aggregate demand curve to the left.
(True/False)
4.9/5 (40)
In the dynamic aggregate demand and aggregate supply model, what is the result of aggregate demand increasing slower than potential real GDP?
(Essay)
4.9/5 (30)
The ________ shows the relationship between the price level and quantity of real GDP demanded.
(Multiple Choice)
5.0/5 (35)
A decrease in government spending will result in a decrease in the price level and a decrease in real GDP in the long run.
(True/False)
4.9/5 (23)
The process of an economy adjusting from a recession back to potential GDP in the long run without any government intervention is known as
(Multiple Choice)
4.8/5 (38)
A decrease in disposable income will shift the aggregate demand curve to the left.
(True/False)
4.8/5 (46)
If rapid increases in oil prices caused price levels to increase and real GDP to decrease in the short run, the economy would experience
(Multiple Choice)
4.8/5 (39)
Figure 9.8 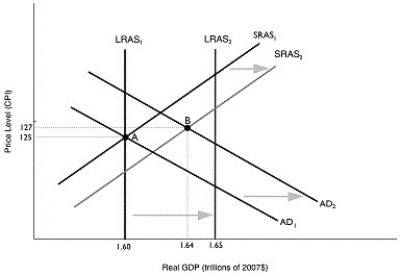 Alt text for Figure 9.8: In figure 9.8, a graph comparing real GDP and price level.
Long description for Figure 9.8: The x-axis is labelled, real GDP (trillions of dollars), with values 1.60, 1.64, 1.65 marked.The y-axis is labelled, price level (CPI), with values 125 and 127 marked.6 lines are shown; SRAS1, SRAS2, AD1, AD2, LRAS1, LRAS2.Line SRAS1 begins in the bottom left corner and slopes up to the top right corner.Line SRAS2 follows the same slope as line SRAS1, but is plotted to the right.The area between lines SRAS1 and SRAS2 is indicated by a right pointing arrow.Line AD1 begins at the top left corner and slopes down to the bottom center.Line AD2 follows the same slope as line AD1, but is plotted to the right.The area between lines AD1 and AD2 is indicated by a right pointing arrow.Line LRAS1 is perpendicular to the x-axis, and begins from the value 1.60.Line LRAS2 is perpendicular to the x-axis, and begins from the value 1.65.The area between lines LRAS1 and LRAS2 is indicated by a right pointing arrow.Line LRAS1 intersects lines AD1 and SRAS1 at point A (1.60, 125).Lines AD2 and SRAS2 intersect at point B (1.64, 127).Points A and B are connected to their respective coordinates on the x-axis and y-axis with dotted lines.Line LRAS2 intersects lines SRAS1 and SRAS2 near the right end of these lines.Similarly, line LRAS2 intersects lines AD1 and AD2 near the right end of these lines.
-Refer to Figure 9.8.Given the economy is at point A in year 1, the unemployment rate will ________ and the price level will ________ in year 2.
Alt text for Figure 9.8: In figure 9.8, a graph comparing real GDP and price level.
Long description for Figure 9.8: The x-axis is labelled, real GDP (trillions of dollars), with values 1.60, 1.64, 1.65 marked.The y-axis is labelled, price level (CPI), with values 125 and 127 marked.6 lines are shown; SRAS1, SRAS2, AD1, AD2, LRAS1, LRAS2.Line SRAS1 begins in the bottom left corner and slopes up to the top right corner.Line SRAS2 follows the same slope as line SRAS1, but is plotted to the right.The area between lines SRAS1 and SRAS2 is indicated by a right pointing arrow.Line AD1 begins at the top left corner and slopes down to the bottom center.Line AD2 follows the same slope as line AD1, but is plotted to the right.The area between lines AD1 and AD2 is indicated by a right pointing arrow.Line LRAS1 is perpendicular to the x-axis, and begins from the value 1.60.Line LRAS2 is perpendicular to the x-axis, and begins from the value 1.65.The area between lines LRAS1 and LRAS2 is indicated by a right pointing arrow.Line LRAS1 intersects lines AD1 and SRAS1 at point A (1.60, 125).Lines AD2 and SRAS2 intersect at point B (1.64, 127).Points A and B are connected to their respective coordinates on the x-axis and y-axis with dotted lines.Line LRAS2 intersects lines SRAS1 and SRAS2 near the right end of these lines.Similarly, line LRAS2 intersects lines AD1 and AD2 near the right end of these lines.
-Refer to Figure 9.8.Given the economy is at point A in year 1, the unemployment rate will ________ and the price level will ________ in year 2.
(Multiple Choice)
4.8/5 (38)
When the price of oil rises unexpectedly, the equilibrium price level ________ and the unemployment rate ________ in the short run.
(Multiple Choice)
4.8/5 (33)
Using an aggregate demand graph, illustrate the impact of an increase in the price level on aggregate demand.
(Essay)
4.7/5 (28)
All of the following would be considered a positive addition to household wealth except
(Multiple Choice)
4.8/5 (24)
Filters
- Essay(0)
- Multiple Choice(0)
- Short Answer(0)
- True False(0)
- Matching(0)