Exam 3: Demand Forecasting
Exam 1: Introduction to Operations Management63 Questions
Exam 2: Competitiveness, Strategic Planning, and Productivity54 Questions
Exam 3: Demand Forecasting172 Questions
Exam 4: A: Product Design74 Questions
Exam 4: B: Product Design56 Questions
Exam 5: A: Strategic Capacity Planning74 Questions
Exam 5: B: Strategic Capacity Planning64 Questions
Exam 6: A: Process Design and Facility Layout157 Questions
Exam 6: B: Process Design and Facility Layout99 Questions
Exam 7: A: Design of Work Systems143 Questions
Exam 7: B: Design of Work Systems68 Questions
Exam 8: A: Location Planning and Analysis74 Questions
Exam 8: B: Location Planning and Analysis16 Questions
Exam 9: Management of Quality98 Questions
Exam 10: A: Statistical Quality Control121 Questions
Exam 10: B: Statistical Quality Control61 Questions
Exam 11: Supply Chain Management86 Questions
Exam 12: Inventory Management168 Questions
Exam 13: Aggregate Operations Planning71 Questions
Exam 14: Material Requirements Planning and Enterprise Resource Planning84 Questions
Exam 15: A: Just-In-Time and Lean Production82 Questions
Exam 15: B: Just-In-Time and Lean Production32 Questions
Exam 16: Job and Staff Scheduling112 Questions
Exam 17: Project Management127 Questions
Exam 18: A: Waiting-Line Analysis76 Questions
Exam 18: B: Waiting-Line Analysis41 Questions
Select questions type
When error values fall outside the limits of a control chart,this signals a need for corrective action
Free
(True/False)
4.9/5  (32)
(32)
Correct Answer: Verified
True
Positive forecast errors,the case when the forecast is low relative to the actual value,are preferable to negative forecast errors,the case when the forecast is higher than the actual value
Free
(True/False)
4.9/5 (30)
Correct Answer:Verified
False
What is the forecast for this year using the naive approach?
Free
(Multiple Choice)
4.8/5 (36)
Correct Answer:Verified
C
Multiple regression procedures permit us to extend associative models to relationships that involve more than one predictor variable.
(True/False)
4.8/5 (44)
What is this week's forecast using a three-week simple moving average?
(Multiple Choice)
4.8/5 (37)
What is the forecast for this year using exponential smoothing with alpha = .4,if the forecast for TWO years ago was 750?
(Multiple Choice)
4.8/5 (36)
Using control charts to monitor forecast error are best suited for forecasting applications involving a single forecast rather than applications involving a series of forecasts (e.g.monthly sales).
(True/False)
4.9/5 (39)
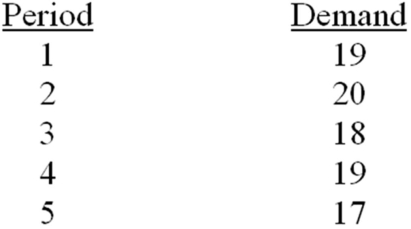
Develop a forecast for the next period,given the data below,using a 3-period moving average.
(Essay)
4.8/5 (30)
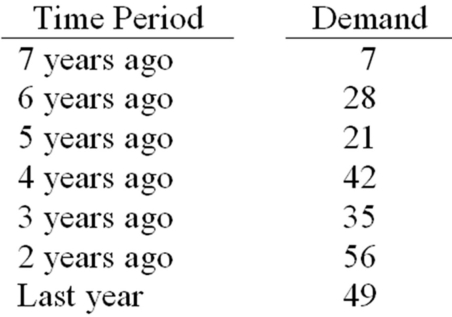 -What is this year's forecast using a four-year simple moving average?
(Short Answer)
4.9/5 (38)
What is this month's forecast using the least squares trend line for these data?
(Multiple Choice)
4.9/5 (32)
What is the forecast for this year using the least squares trend line for these data?
(Multiple Choice)
4.9/5 (42)
Use of simple linear regression analysis assumes that :
I.Variations around the line are random.
II.Deviations around the line are normally distributed.
III.Predictions are to be made only within the range of observed values of the predictor variable.
(Multiple Choice)
4.9/5 (25)
A proactive approach to forecasting views forecasts as probable descriptions of future demand,assuming actions can be taken to meet that demand.
(True/False)
4.8/5 (38)
A managerial approach toward forecasting which seeks to actively influence demand is:
(Multiple Choice)
4.8/5 (34)
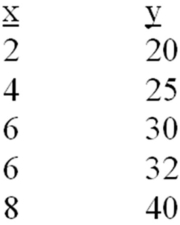
Given the following data,develop a linear regression model for y as a function of x.
(Essay)
4.9/5 (31)
Filters
- Essay(0)
- Multiple Choice(0)
- Short Answer(0)
- True False(0)
- Matching(0)